
Every sales leader wants a predictable path to hitting revenue goals. While sales teams have access to more data than ever, many are starving for the insights that actually drive performance. When B2B sales metrics are tracked consistently, they become a roadmap to predictable growth
When everyone sees the same data, it becomes easier to forecast accurately, coach effectively, and focus on the activities that generate real revenue — a critical link, as employees who understand how success is measured are twice as likely to feel motivated.
This guide walks through the essential B2B sales metrics your team needs to track. We’ll explore the difference between metrics and KPIs, break down 15 critical indicators for revenue and pipeline health, show you how to select the right ones for your business goals, and help you avoid common mistakes that cost teams revenue.
Try monday CRMKey takeaways
- Focus on 5-7 core metrics that directly impact revenue instead of tracking everything.
- Track pipeline coverage ratio, average deal size, and sales cycle length as your foundation to assess whether you have enough deals, their value, and closing speed.
- Balance leading indicators (like call volume) with lagging indicators (like revenue) for complete visibility and to fix problems before they hurt results.
- Use real-time data for daily decisions and historical trends for strategic long-term planning.
- Smart software like monday CRM automates metric tracking with drag-and-drop dashboards and AI-powered insights.
What are B2B sales metrics?
B2B sales metrics are numbers that show how well your sales team performs. They track everything from first contact with a lead to sales closing and keeping customers happy.
Think of these metrics as your sales scorecard. Just like a sports team tracks wins, losses, and player stats, your sales team needs to track calls made, deals closed, and revenue generated.
Here’s what makes B2B sales metrics unique:
- Longer sales cycles: B2B deals take weeks or months — not days.
- Multiple decision-makers: You’re selling to teams, not individuals, with the typical buying group now involving 6 to 10 stakeholders, according to Gartner.
- Higher deal values: Each sale matters more to your bottom line.
- Relationship focus: Success depends on building trust over time.
Sales metrics vs. KPIs for B2B teams
All KPIs are metrics, but not all metrics are KPIs. Here’s the difference:
- Sales metrics include every number you can track, including calls made, emails sent, meetings booked, and so on.
- KPIs are the handful of metrics that directly impact your business goals, such as monthly recurring revenue or win rate.
Most teams drown in metrics while ignoring their KPIs. Avoid this mistake by picking 5-7 KPIs that align with your biggest priorities and checking them daily.
How B2B sales metrics drive revenue growth
You can’t improve what you don’t measure. That’s why B2B sales metrics are essential for growing your business and shaping a strong sales strategy.
These metrics show you exactly where deals get stuck, which reps need coaching, and what activities actually lead to closed deals. Without them, you’re guessing about what works.
- Forecast with confidence: Want to know if you’ll hit your quarterly targets? The right metrics make accurate predictions possible. You’ll see trends before they become problems and spot opportunities while there’s still time to act.
- Allocate resources strategically: Some sales activities generate 10x more revenue than others. Maybe your team spends hours on cold calls that rarely convert. Or perhaps one lead source delivers deals twice as large as others. Metrics reveal which ones deserve your time and sales budgets.
- Accelerate team performance: Top performers leave clues — a key aspect of sales performance management. When you know that your best rep makes 50 calls before 10 a.m. or always sends follow-ups within an hour, you can coach others to adopt these winning habits.
- Make data-driven decisions: Gut feelings don’t scale, but data does. Metrics replace guesswork with facts, helping you make confident decisions about everything from hiring to territory planning with advanced sales analytics.
15 critical B2B sales metrics every team needs
These 15 metrics cover your entire sales process. Master these, and you’ll have the insights needed to grow revenue predictably.
Revenue metrics that matter
Revenue metrics show whether your sales efforts translate into real money. They’re the ultimate measure of sales success.
1. Monthly recurring revenue (MRR)
MRR is the predictable revenue you collect every month from subscriptions or contracts. If you charge $1,000 per month for your service and have 100 customers, your MRR is $100,000.
This metric matters because it shows the health of your business at a glance. Growing MRR means you’re adding customers faster than you’re losing them.
2. Annual contract value (ACV)
ACV is the average yearly value of your customer contracts. Use ACV to understand if you’re moving upmarket (higher ACV) or down-market (lower ACV). For example, a customer paying $2,000 per month has an ACV of $24,000. This guides everything from sales training to marketing strategy.
3. Customer lifetime value (CLV)
CLV predicts how much revenue a customer will generate over their entire relationship with you. Knowing CLV helps you decide how much to spend acquiring customers, which is especially effective when leveraging customer segmentation.
For example, a customer who stays for 3 years at $1,000 per month has a CLV of $36,000, so spending $5,000 to win that customer makes sense.
Pipeline health indicators
Pipeline metrics tell you if you have enough deals to hit your targets. They’re like a weather forecast for your sales results.
4. Pipeline coverage ratio
This ratio compares your pipeline value to your sales target. If you need $100,000 in sales and have $300,000 in your pipeline, your coverage ratio is 3:1. Most teams need at least 3x coverage because not every deal closes. Track this weekly to avoid end-of-quarter surprises.
5. Pipeline velocity
Pipeline velocity, also known as sales velocity, measures how fast deals move through your sales process. It combines four factors:
- Number of deals
- Average deal size
- Win rate
- Sales cycle length
Faster velocity means more revenue with the same effort. Even small improvements in velocity can dramatically increase revenue.
6. Average deal size
This is simply the typical value of your closed deals. Add up all deal values and divide by the number of deals. Growing deal size often has more impact than increasing deal volume. Focus on selling more value to each customer rather than finding more customers.
7. Win rate
Win rate shows what percentage of your opportunities become customers. If you work 100 opportunities and close 25, your win rate is 25%. Track win rate by lead source, rep, and product to find what’s working. Then do more of what works.
Sales activity metrics
Activity metrics track what your team does every day. They’re leading indicators that predict future results.
8. Lead response time
This measures how quickly you contact new leads. The faster you respond, the more likely you’ll connect while they’re still interested — in fact, many sales pros say you’re 100 times more likely to connect with a lead if you reach out within 5 minutes.
Pro tip: If you’re busy and want to automate instant responses, monday CRM ensures you never miss that critical first-hour window when leads are most engaged.
9. Activities per rep
Count the calls, emails, and meetings each rep completes daily. This shows who’s putting in the effort and who might need help. Look for patterns in your top performers’ activity levels. If they all make 60+ calls daily, that’s your benchmark.
10. Email engagement rates
These rates show if prospects actually read and respond to your emails. Track opens, clicks, and replies to improve your messaging. Here’s what solid B2B email engagement looks like:
- Open rates: 15-25%
- Click rates: 2-5%
- Reply rates: 1-3%
Conversion performance metrics
Conversion metrics reveal where prospects drop out of your sales process. Fix these leaks to close more deals.
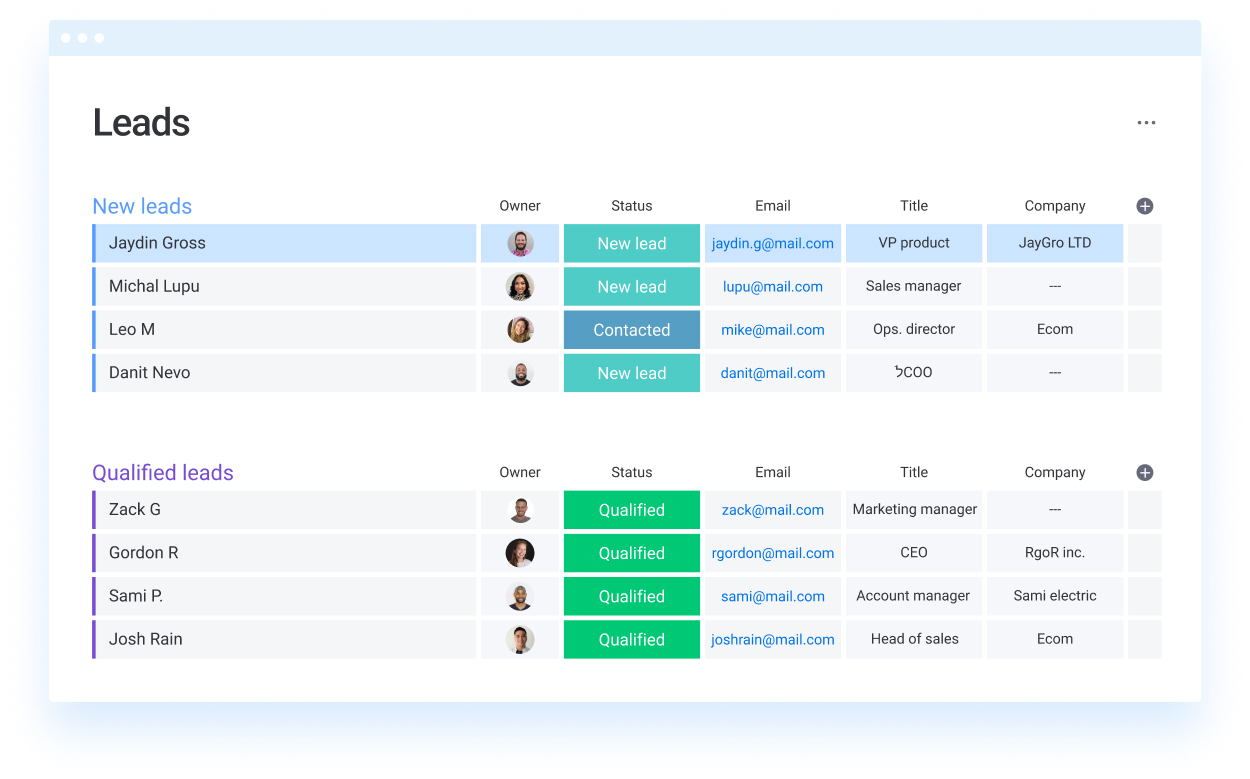
11. Lead-to-opportunity ratio
This shows what percentage of leads become real sales opportunities. If 100 sales leads generate 15 opportunities, your ratio is 15%. Low ratios mean you need better lead qualification or higher-quality lead sources.
12. Opportunity-to-close ratio
Once someone becomes a qualified opportunity, how often do they buy? This ratio shows your closing effectiveness. If this ratio is low, focus on sales training and better opportunity qualification.
13. Sales cycle length
Sales cycle length is the time from first contact to closed deal. Shorter cycles mean faster revenue and happier customers. Track cycle length by deal size and lead source using sales tracking. You might find that certain types of deals close much faster.
Team productivity indicators
These metrics show if your team operates efficiently and hits their targets consistently.
14. Quota attainment rate
This percentage shows how many reps hit their sales targets. If 8 out of 10 reps make quota, your attainment rate is 80%. Low attainment might mean unrealistic quotas or inadequate training. High attainment could signal it’s time to raise targets.
15. Revenue per sales rep
Divide total revenue by number of reps to get this metric. It helps you plan hiring and set compensation. Compare this metric to industry benchmarks and your own historical performance to gauge productivity trends.
How do you select the right B2B sales metrics?
Instead of trying to track everything, focus on metrics that drive real decisions and align with your goals and KPIs. Here are some tips for how to select the right B2B sales metrics.
- Determine business objectives: What’s your biggest priority right now? Growth? Profitability? Market expansion? Your metrics should reflect these goals. If growth matters most, track pipeline velocity and lead volume. If profitability is key, focus on deal size and customer retention metrics.
- Evaluate your sales process: Complex enterprise sales need different metrics than transactional inside sales. Match your metrics to how you actually sell. Long sales cycles require stage-by-stage conversion tracking. Quick sales might focus more on volume and activity metrics.
- Scale metrics to team size: Small teams need simple metrics they can act on immediately. Large teams can handle more sophisticated tracking but still need clear priorities.
- Balance leading and lagging indicators: Leading indicators predict what will happen, such as call volume, pipeline coverage, lead quality. Lagging indicators show what already happened, including revenue, win rate, and customer churn. At the end of the day, you need both.
B2B sales metrics benchmarks across industries
Not all industries sell the same way, which means your metrics need context to be meaningful. A 30-day sales cycle might be slow for SaaS but lightning-fast for manufacturing. Understanding industry-specific benchmarks helps you set realistic targets, identify what’s working, and spot areas where your team can improve. Here’s what strong performance looks like across four major B2B sectors.
Technology and SaaS standards
SaaS companies benefit from product-led growth and shorter decision cycles, making certain metrics especially telling for this fast-moving industry.
- Monthly recurring revenue (MRR) growth rate: Healthy SaaS companies target 10-20% MRR growth monthly in early stages, with steady growth indicating strong product-market fit and effective customer acquisition.
- Pipeline velocity: SaaS teams typically see higher velocity because prospects can trial products before buying, making this metric crucial for forecasting and identifying bottlenecks in your sales process.
- Customer churn rate: Keep monthly churn below 5% to maintain sustainable growth, as high churn undermines acquisition efforts and signals product or service issues that need immediate attention.
Manufacturing and distribution targets
Complex products and custom configurations define manufacturing sales, requiring patience and metrics that reflect relationship-building over quick wins.
- Sales cycle length: Expect 6-18 month cycles due to multiple stakeholders and technical evaluations, making this your most important planning metric for resource allocation and revenue forecasting.
- Average deal size: Manufacturing deals typically range from $50K to several million, so tracking deal size helps you prioritize opportunities and allocate engineering resources effectively.
- Customer lifetime value (CLV): Long-term partnerships and repeat orders make CLV exceptionally high in manufacturing, justifying extended sales cycles and significant upfront investment in relationship-building.
Professional services benchmarks
Consultative selling and custom solutions create unique metric patterns in professional services, where trust and expertise drive conversions more than product features.
- Win rate: Professional services often achieve 30-40% win rates thanks to consultative approaches and strong referral networks, making this a key indicator of your team’s ability to demonstrate value.
- Client retention rate: Retaining 90%+ of clients annually is standard in professional services, as ongoing relationships generate predictable revenue and reduce costly acquisition efforts.
- Revenue per client: Track expansion revenue from existing clients, which often exceeds new client revenue in mature professional services firms and indicates strong client satisfaction and upsell effectiveness.
Financial services metrics
Regulatory requirements and trust-building create a unique sales environment in financial services, where patience and compliance shape every metric.
- Customer lifetime value (CLV): Financial services clients often stay for decades, creating exceptionally high CLV that justifies longer sales cycles and significant relationship investment upfront.
- Compliance conversion rate: Track what percentage of interested prospects complete required compliance steps, as regulatory hurdles create a unique conversion challenge specific to financial services.
- Referral rate: Financial services rely heavily on referrals, with top firms seeing 40%+ of new business from existing client recommendations—a metric that reflects trust and service quality better than any other.
Build your B2B sales metrics dashboard
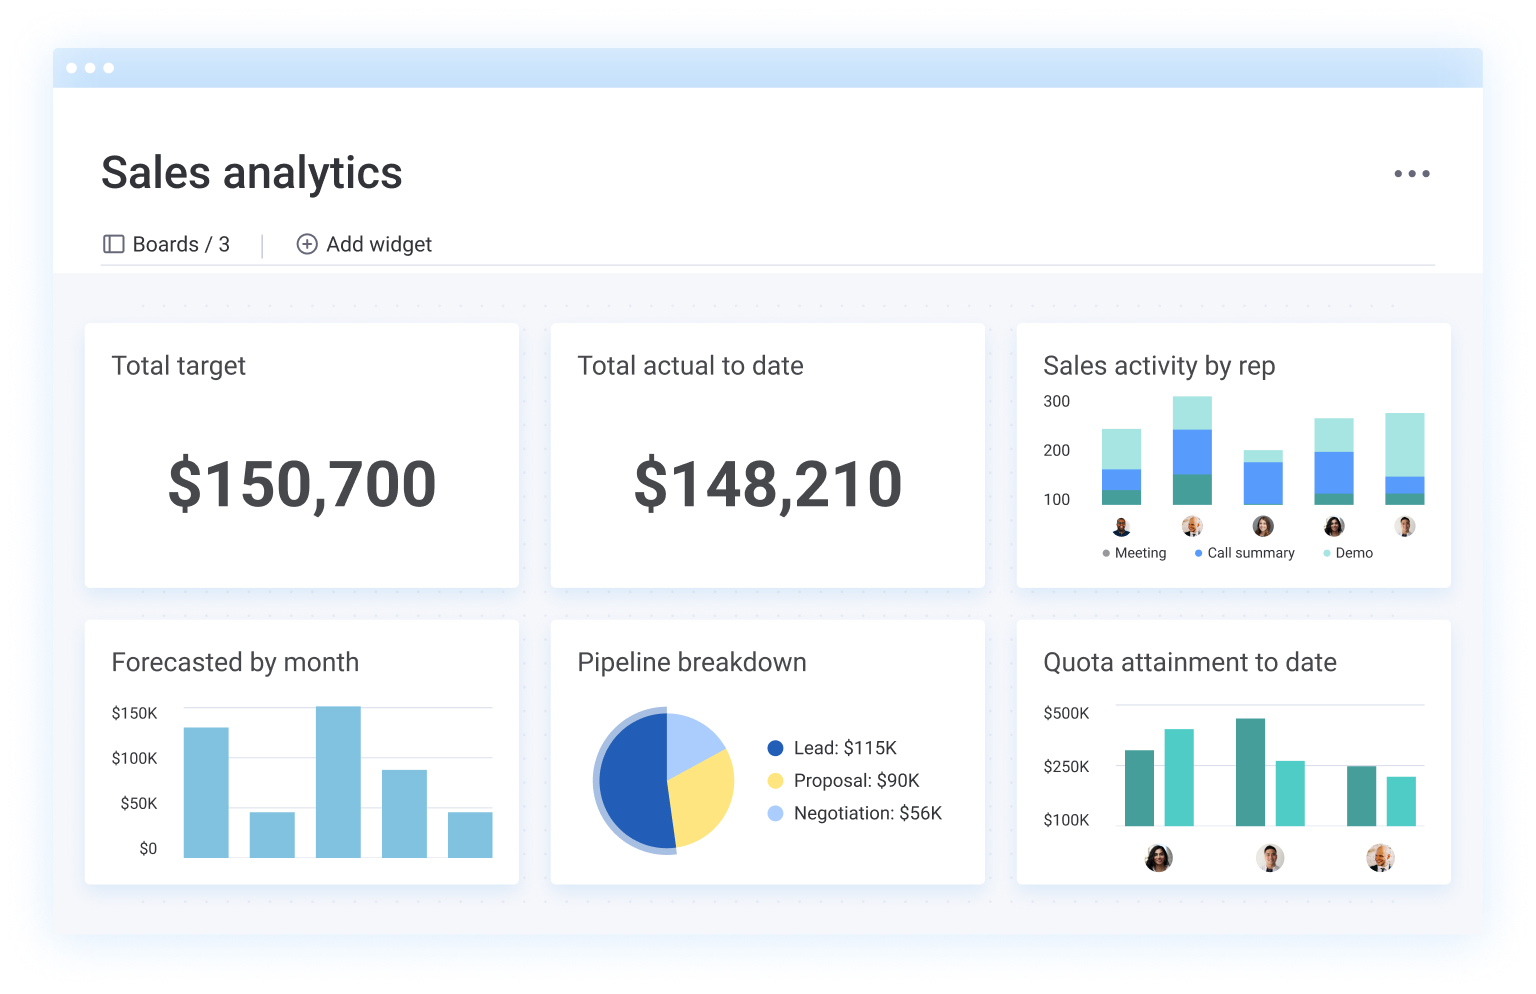 A good dashboard shows what matters at a glance. It should answer your most important questions without requiring analysis. Every sales dashboard needs these components to drive daily decisions:
- Pipeline snapshot: Current value and stage distribution
- Performance trends: Are you on track to hit targets?
- Activity tracking: What’s your team doing right now?
- Win/loss analysis: Why are deals closing or stalling?
Real-time data vs historical trends
Use real-time data for daily management. Check pipeline changes, new leads, and rep activity as they happen. Historical trends guide strategic decisions. Look at quarterly patterns and year-over-year growth for planning.
Visualization that drives action
 Good visualizations make problems obvious. Use color coding: Red for danger, yellow for caution, green for on-track. Keep charts simple. If you need to explain how to read it, it’s too complex.
Automated reporting and alerts
Set up alerts for critical changes like deals going dark or pipeline dropping below safe levels using smart software like monday CRM, which automates these notifications so you can focus on selling. Regular automated reports keep everyone aligned without manual work, ensuring your sales plan stays on track.
Try monday CRM5 ways to get more value from your B2B sales metrics
Tracking the right metrics is only half the battle. The real challenge is turning that data into actionable insights that drive revenue growth. Many teams collect mountains of data but struggle to extract meaningful value from it. Here are five proven strategies to maximize the impact of your B2B sales metrics and avoid the common pitfalls that limit performance.
- Focus on fewer, more impactful metrics: When everything is important, nothing is important. Stick to 5-7 core metrics that directly impact revenue. Review others monthly or quarterly.
- Balance leading and lagging indicators: Lagging indicators tell you what happened last month. By then, it’s too late to fix problems. Balance with leading indicators that give you time to course-correct.
- Standardize metric definitions across teams: When everyone calculates win rate the same way, it enables meaningful conversations about performance. Document exactly how to calculate each metric. Use monday CRM to automate calculations and ensure consistency.
- Set contextual, achievable targets: Arbitrary targets demotivate teams. Use historical performance and market conditions to set achievable but challenging goals. Explain why targets matter and how they connect to company success.
- Prioritize data quality and consistency: High-quality data leads to confident decisions. When reps consistently update the CRM, your metrics become a reliable source of truth. Make data entry easy and show reps how accurate data helps them sell more.
Transform your sales metrics with monday CRM
Tracking B2B sales metrics doesn’t have to be complicated. With monday CRM, you get simple, actionable insights without complex setup or technical expertise required. The platform transforms raw data into clear visibility that drives revenue decisions, giving your team the power to act on what matters most.
Customize metrics without code
 Build the exact dashboard you need with drag-and-drop simplicity. Track any metric that matters to your business without waiting for IT support. Whether you’re monitoring pipeline coverage, win rates, or deal velocity, you can configure views that match your unique sales process in minutes, not weeks.
Add new metrics as your business evolves. What matters today might change tomorrow, and the flexibility of monday CRM adapts with you. As your team grows or your strategy shifts, you can instantly adjust tracking to reflect new priorities without disrupting your workflow or losing historical data.
AI-powered sales intelligence
Let AI do the heavy lifting. The AI features in monday CRM spot patterns, predict outcomes, and suggest next best actions based on your metrics, showcasing the benefits of AI in B2B sales. Instead of manually analyzing spreadsheets, you get intelligent recommendations that help you prioritize the right deals at the right time.
AI Blocks can analyze deal sentiment, categorize leads, and flag at-risk opportunities automatically. This means your team spends less time on data entry and analysis, and more time having conversations that close deals. The AI learns from your sales patterns to deliver increasingly accurate predictions about which opportunities deserve your attention.

Real-time pipeline visibility
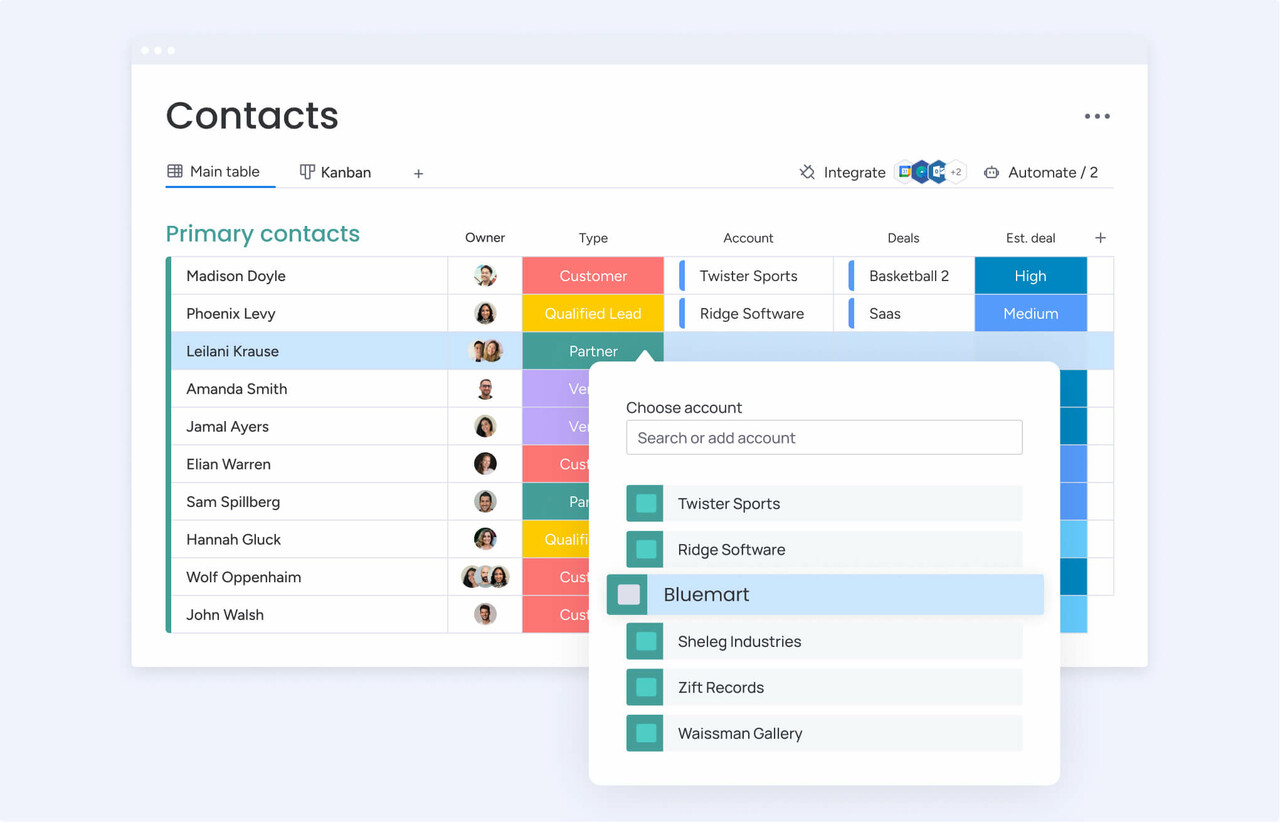
See your entire pipeline at a glance. Drill down into any deal, stage, or rep with one click. Real-time updates mean you’re never working with stale data—every change your team makes appears instantly, giving you confidence that your decisions are based on current reality, not yesterday’s snapshot.
Custom views let each team member see their most relevant metrics without information overload. Sales reps can focus on their personal performance and next actions, while managers get the big-picture view they need for coaching and forecasting. Everyone sees exactly what they need, when they need it.
Unified revenue platform

Connect sales metrics with marketing, customer success, and finance data with a powerful B2B CRM. Breaking down silos becomes effortless with monday CRM, showing you the complete revenue picture from first touch to renewal. When all your revenue teams work from the same data, you eliminate conflicting reports and gain a single source of truth.
This unified approach reveals insights you’d miss with standalone systems. See how marketing campaigns impact deal velocity, how customer success activities drive expansion revenue, and how sales performance connects to overall company growth. The platform brings together every piece of your revenue puzzle so you can make decisions with complete context.
Start tracking the metrics that matter
The right B2B sales metrics transform guesswork into predictable revenue growth. By focusing on the 15 critical metrics outlined in this guide — from pipeline coverage and deal velocity to win rates and customer lifetime value — your team gains the visibility needed to forecast accurately, coach effectively, and close more deals.
Ready to turn your sales metrics into revenue growth? With monday CRM, tracking, analyzing, and acting on your B2B sales metrics becomes effortless. See how the right platform transforms measurement from a reporting chore into a competitive advantage.
Try monday CRMFAQs
How often should B2B sales teams review their metrics?
B2B sales teams should review activity metrics like calls and emails daily, pipeline metrics weekly, and revenue metrics monthly. Daily activity reviews keep performance consistent, while weekly pipeline reviews catch problems early enough to fix them before quarter-end.
What are the most important sales metrics for small B2B teams?
The most important sales metrics for small B2B teams are pipeline coverage ratio, average deal size, and sales cycle length. These three metrics provide essential visibility into whether you have enough deals, if they're worth pursuing, and how quickly you can close them.
How do you calculate customer acquisition cost for B2B sales?
Customer acquisition cost equals your total sales and marketing expenses divided by the number of new customers acquired in that period. Include salaries, software costs, advertising spend, and any other expenses directly related to winning new customers.
Which B2B sales metrics best predict future revenue growth?
Pipeline velocity, lead quality scores, and customer expansion rates best predict future revenue growth. Pipeline velocity shows how fast you're moving deals, lead quality indicates conversion potential, and expansion rates reveal if existing customers will buy more.
How many sales KPIs should B2B teams track actively?
B2B teams should actively track between 5 and 7 core KPIs to maintain focus while getting comprehensive insights. This range provides enough data for informed decisions without creating analysis paralysis or overwhelming team members with too many metrics.
What role does AI play in B2B sales metrics tracking?
AI automates data collection, identifies patterns humans miss, and provides predictive insights for better decision-making. Modern AI can forecast deal outcomes, suggest which leads to prioritize, and alert teams to at-risk opportunities before they're lost.