

For many product teams, reporting feels like an administrative burden that pulls time away from building. In reality, it’s what connects strategy to execution. Without structured reporting, teams operate in silos, leadership lacks visibility, and decisions rely on incomplete information.
Product managers need clear frameworks that translate technical progress into business impact and keep stakeholders aligned. Standardized report templates create consistency while remaining flexible enough to adapt to different audiences and contexts.
This guide walks through the seven essential report templates every product team needs for success. It explores everything from high-level roadmap visualizations for leadership to detailed sprint performance dashboards for agile teams.
Key takeaways
- Save hours with pre-built frameworks: report templates eliminate starting from scratch and ensure consistent information delivery across teams, helping you communicate progress to stakeholders efficiently.
- Seven essential report types: roadmap visualization, sprint performance, feature prioritization, cross-team alignment, launch readiness, stakeholder communication, and customer feedback analysis each serve specific audiences and decision-making scenarios.
- Real-time dashboards and custom templates: platforms like monday dev let you build any report type without technical expertise, automatically pulling data from existing systems while keeping teams aligned through shared visibility.
- Core components for actionable insights: executive summaries, data visualization, action items, risk assessments, and progress tracking ensure stakeholders can quickly understand and act on information.
- AI-enhanced reporting capabilities: predictive analytics, automated insights, and natural language summaries help you anticipate trends and make faster decisions as modern platforms integrate these capabilities directly into your workflow.
What are product manager report templates?
Product manager report templates are pre-built frameworks that standardize how you collect, organize, and present product data to stakeholders. They provide consistent structures for everything from sprint updates to roadmap reviews, saving you from starting from scratch each time you need to communicate progress.
Templates serve as the communication backbone for product management. When managing multiple features and stakeholders across engineering, marketing, and leadership, templates ensure all parties receive the necessary information in a format that facilitates quick comprehension and decision-making.
Essential components of PM reports
Every effective product manager report includes core elements that transform raw data into actionable insights. These components are the building blocks of a clear narrative, ensuring stakeholders can quickly understand the story behind the data and act on it. Key elements include:
- Executive summary: a concise overview capturing critical information in two to three sentences.
- Data visualization: charts and graphs that make complex information digestible at a glance.
- Action items: specific next steps with assigned owners and deadlines.
- Risk assessment: potential blockers and proposed mitigation strategies.
- Progress tracking: regular updates on milestones and completion rates.
How templates accelerate product development?
Templates remove the friction that slows down product teams. You reclaim hours each week that can go toward actual product work instead of formatting reports.
Consistency also speeds up decision-making. This is particularly important given that in a 2023 McKinsey report, only about one-third of respondents said they were confident in their organizations’ ability to manage complex changes effectively. Stakeholders learn where to find information, so they can review updates quickly and provide feedback faster.
Solutions like monday dev take this efficiency further by letting you build custom report templates that automatically pull real-time data from your boards.
7 must-have report templates for product success
Product managers rely on different reports depending on the audience and decision at hand. The following seven templates cover the most common reporting needs across strategy, execution, and stakeholder alignment.
1. Product roadmap visualization reports
Roadmap reports turn strategic vision into clear, time-based plans that both technical and business stakeholders can understand. They align cross-functional teams around shared priorities and delivery timelines.
Effective roadmap reports include quarterly timeline views, dependency mapping to highlight interconnected work, and resource allocation indicators that show where team capacity is concentrated.
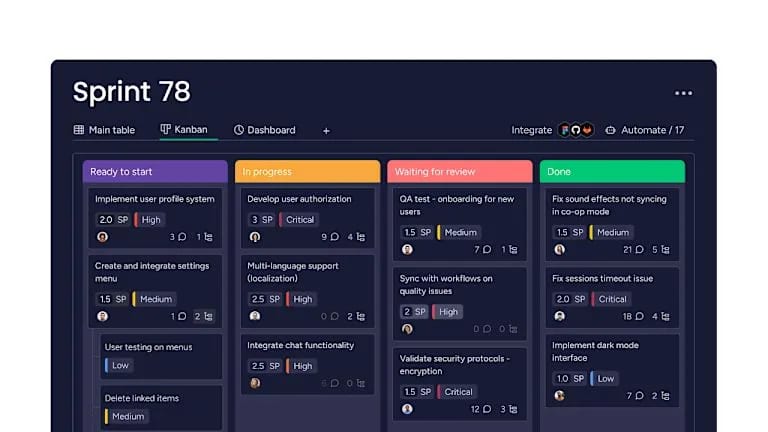
2. Sprint velocity and performance dashboards
Sprint dashboards measure how much work the team completes in each development cycle. They improve delivery predictability and surface capacity constraints before they impact releases.
Core elements include velocity trends across recent sprints, planned versus actual capacity comparisons, and bottleneck analysis to identify where work slows down.
3. Feature prioritization matrices
Prioritization matrices provide a structured way to decide what to build next. They bring objectivity to trade-off discussions by weighing impact, effort, and strategic alignment.
Features are scored based on business value, estimated effort, and overall importance, then visualized on value-versus-effort grids to support clear, data-informed decisions.
4. Cross-functional alignment trackers
Alignment trackers keep engineering, marketing, and sales coordinated throughout the product lifecycle. They reduce miscommunication and prevent launch delays in increasingly complex operating environments.
These reports include scheduled communication checkpoints, shared milestone tracking across functions, and responsibility matrices that clearly define ownership.
5. Product launch readiness checklists
Launch readiness reports provide a structured framework to confirm that every component is prepared before release. They validate technical stability, marketing readiness, support enablement, and compliance requirements in one consolidated view.
6. Stakeholder communication reports
Stakeholder reports tailor information to different audiences. Executives receive concise strategic summaries, while engineering teams access detailed operational breakdowns relevant to execution.
7. Customer feedback analysis templates
Feedback reports convert qualitative input into actionable insights. They group feedback by theme, evaluate its impact on user satisfaction, and track the status of feature requests to ensure customer voices influence the roadmap.

"monday dev empowered us to optimize our GTM approach, resulting in faster, more dependable deliveries"
Steven Hamrell | Director of Product Management
"monday dev empowers us to manage the entire development process on one platform so we can speed up product delivery and improve customer satisfaction"
Mitchel Hudson | Head of Technology
"We're operating in an open, deep trusting, transparent environment with no silos of information. It's about completely opening access to everyone who needs it."
Alan Schmoll | Executive Vice President, Vistra PlatformProduct roadmap templates driving strategy
Roadmap reports do more than list features; they tell the story of your product strategy. The best roadmaps connect individual tasks to quarterly goals and long-term business objectives, giving every stakeholder a clear view of not just what you’re building, but why it matters and when it’ll ship.
Strategic initiative timelines
Strategic timelines tie features and initiatives directly to broader business goals. The level of detail should be tailored to the audience:
| Timeline View | Audience | Primary Purpose |
|---|---|---|
| Quarterly | Executives, PMs | Align on near-term priorities |
| Annual | Leadership | Plan major releases and budgets |
| Multi-year | Board, C-suite | Communicate long-term vision |
Portfolio management views
Portfolio views help organizations managing multiple products allocate resources and track performance across the entire portfolio. They show how teams and budgets are distributed, highlight cross-product dependencies, and aggregate metrics on revenue and adoption.
Dependency mapping reports
Dependencies are where roadmaps often break down. These reports make interdependencies explicit through technical dependency diagrams, team dependency tracking, and critical path identification.
Modern work management platforms offer board connection features that let you link related items across boards, creating clear views of how work flows through your organization.
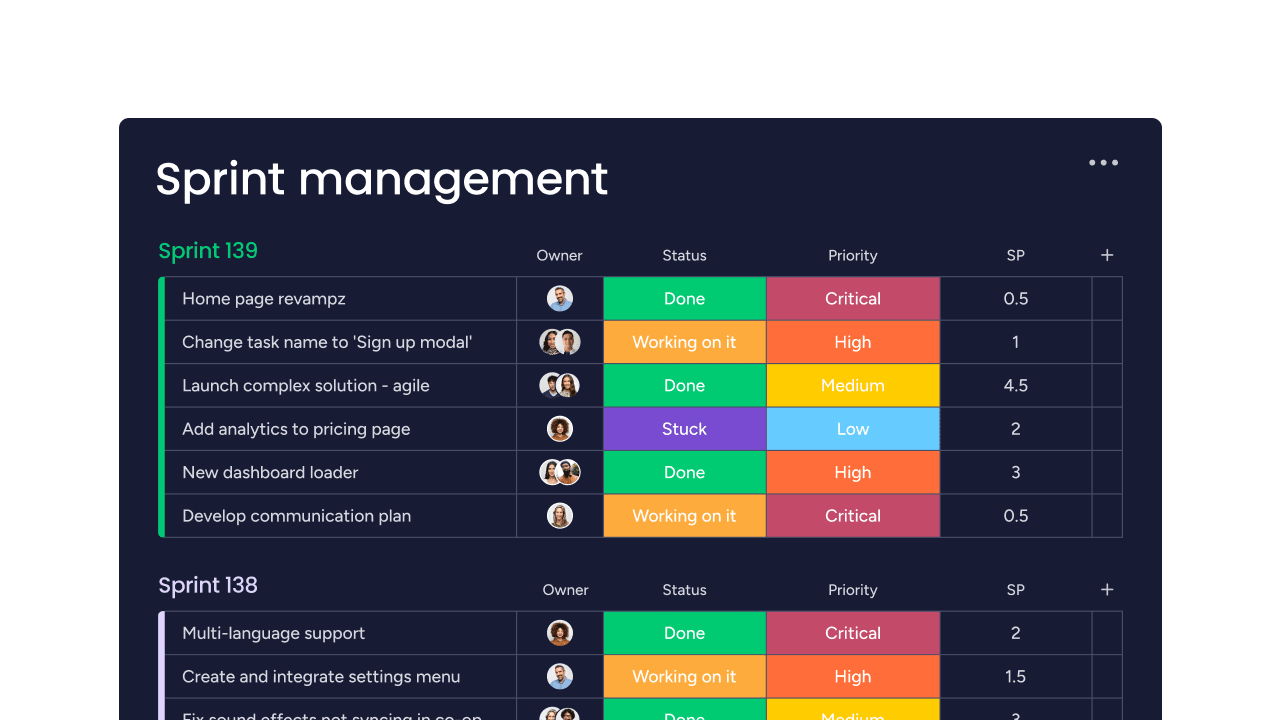
Sprint performance reports for Agile teams
Sprint reports help teams improve delivery predictability and identify areas for continuous improvement. They track work completed in each time-boxed cycle.
Velocity tracking dashboards
Velocity measures work completed per sprint, providing a baseline for capacity planning. Teams measure velocity differently:
| Metric | Best For | Pros | Cons |
|---|---|---|---|
| Story Points | Agile teams | Normalizes across tasks | Requires calibration |
| Tasks Completed | Small teams | Easy to track | Ignores task size |
| Features Delivered | Product teams | Tied to outcomes | Features vary in size |
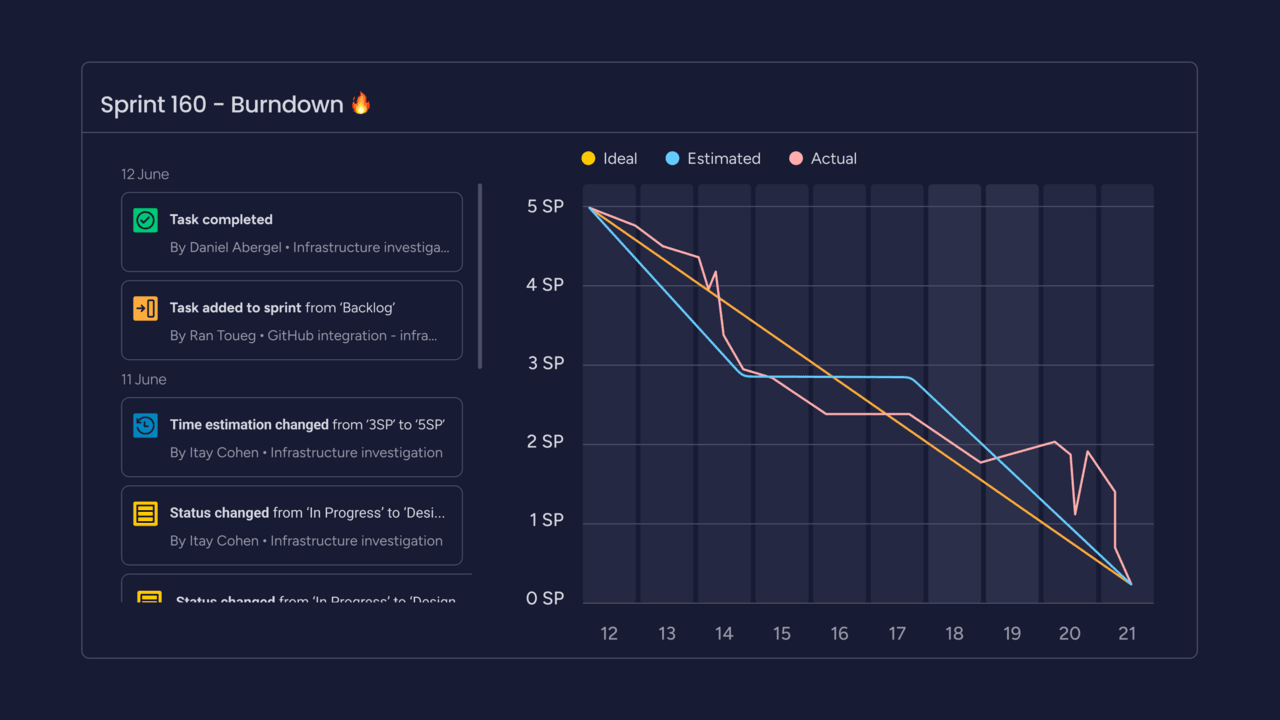
Burndown and burnup charts
Burndown charts show remaining work in a sprint. Burnup charts display completed work. Both reveal whether you’re on track to meet sprint goals and make scope changes visible.
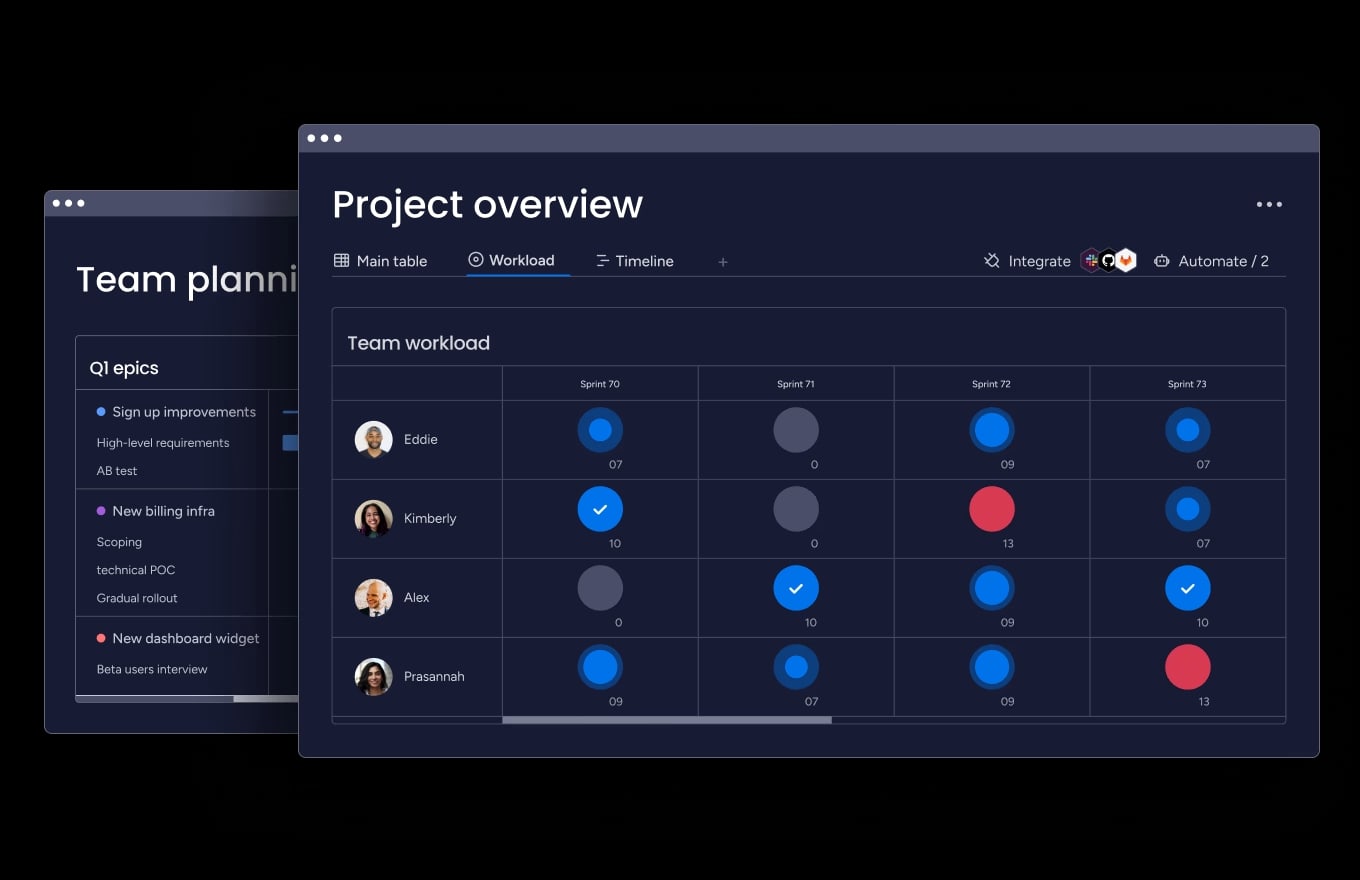
Team capacity reports
Capacity reports provide realistic views of what teams can deliver based on availability and skills. They factor in vacation planning, identify skill gaps, and visualize workload distribution.
Feature prioritization templates
Prioritization templates bring structure to subjective decisions. They help you balance competing demands from customers, stakeholders, and business goals.
Customer request scoring models
Scoring models evaluate feature requests systematically. Different approaches work for different situations:
- Weighted scoring: customizable criteria with different importance weights.
- RICE method: scores reach, impact, confidence, and effort.
- Value vs. effort matrix: simple two-axis visual comparison.
ROI impact calculators
ROI calculators help justify investments by measuring expected business value against development cost. They include revenue impact estimation, cost breakdowns, timeline considerations, and risk adjustments.
Market segment analysis reports
Segment analysis reveals which customer groups benefit most from specific features. It identifies key segments, assesses how features address their pain points, and forecasts adoption likelihood.
Cross-team alignment reports
Alignment templates create shared understanding between technical and business teams. They ensure everyone moves toward common goals.
- Engineering to business dashboards: these dashboards translate technical progress into business-relevant metrics. They map technical milestones to business objectives, link metrics like revenue impact to technical work, and flag issues with business implications.
- Product marketing sync templates: sync templates ensure marketing has the information they need for successful launches. They provide clear feature descriptions, competitive positioning analysis, and shared launch timelines.
- Resource allocation trackers: resource trackers show how capacity is distributed across teams. Key metrics vary by team type — engineering tracks capacity by project, design monitors asset readiness, QA tracks test coverage, and marketing monitors campaign readiness.
Product launch templates for flawless releases
Launch templates help teams reduce risk and ensure a successful release by enabling systematic preparation and cross-team alignment.
- Pre-launch readiness reports: readiness reports confirm all teams are prepared for launch. They verify technical stability, marketing campaign schedules, sales team training, and support team knowledge bases.
- Go-to-market alignment dashboards: GTM dashboards ensure customer-facing teams share unified messaging. They centralize key messages, track channel readiness, provide competitive comparisons, and synchronize launch dates.
- Post-launch success metrics: success metrics measure release impact and identify improvements. Track adoption rates in the first one to four weeks, ongoing user engagement, revenue impact within one to three months, and support ticket volume.
Executive reporting templates
Executive reports focus on strategic insights rather than operational details. They support high-level decision-making without overwhelming leadership.
Monthly performance snapshots
Snapshots provide high-level views of product progress. They include key performance indicators, trend analysis showing changes over time, and strategic recommendations for next steps.
Portfolio health dashboards
Portfolio dashboards offer comprehensive views across multiple products. They aggregate revenue and engagement data, compare resource usage to outcomes, and show which products support business goals.
Risk mitigation reports
Risk reports help executives anticipate challenges. Different risk types require different responses:
| Risk Category | Indicators | Mitigation Strategies |
|---|---|---|
| Technical | High defect rates | Code reviews, automated testing |
| Market | Declining demand | Market research, feature pivots |
| Competitive | New entrants | Differentiation, value-added services |
| Resource | Team attrition | Cross-training, contingency funds |
"monday dev empowered us to optimize our GTM approach, resulting in faster, more dependable deliveries"
Steven Hamrell | Director of Product Management
"monday dev empowers us to manage the entire development process on one platform so we can speed up product delivery and improve customer satisfaction"
Mitchel Hudson | Head of Technology
"We're operating in an open, deep trusting, transparent environment with no silos of information. It's about completely opening access to everyone who needs it."
Alan Schmoll | Executive Vice President, Vistra PlatformAI-enhanced reporting for 2026
AI transforms how product managers create and consume reports. Modern platforms integrate AI capabilities directly into reporting workflows.
- Predictive analytics dashboards: AI-powered analytics help you anticipate trends before they become problems. Algorithms forecast user growth and feature adoption. Automated alerts highlight unusual patterns. Interactive simulations let you test strategies and see projected outcomes.
- Automated insight generation: AI surfaces patterns humans might miss. It identifies recurring themes in customer feedback, finds relationships between features and outcomes, and generates actionable recommendations based on real-time analysis.
- Natural language summaries: AI translates complex data into plain language. It creates instant summaries from dashboards, tailors updates for different audiences, and provides reports in multiple languages for global teams.
Customizing templates for your workflow
Templates must adapt to your specific workflows and business needs. Therefore, customization ensures they support rather than constrain your process.
Adapting to hybrid methodologies
Many organizations blend agile and traditional approaches. Templates must accommodate both:
- Roadmaps: Agile teams use iteration-based timelines, waterfall uses phase-based Gantt charts, hybrid combines both.
- Progress tracking: Agile tracks velocity and burndowns, waterfall tracks percent complete, hybrid needs both metrics.
- Risk assessment: Agile uses retrospectives, waterfall maintains risk logs, hybrid integrates both approaches.
Building custom KPIs
Custom KPIs ensure you track what matters to your specific business. Start with selection criteria prioritizing business relevance. Define clear measurement methodology. Align stakeholders on definitions. Review regularly to ensure continued relevance.
Integration best practices
Integrations increase efficiency by reducing manual data entry. Connect directly to development platforms and analytics systems. Automate report generation and notifications. Ensure seamless workflow integration. Respect security and access controls.
Enhance product reporting with monday dev
Modern product teams’ reporting challenges find their solution in monday dev, a flexible platform designed for visibility, alignment, and speed. Create and customize all report types discussed in this guide, adapting to any workflow without technical expertise.
Real-time dashboards let you build custom reports rapidly. Cross-team collaboration keeps everyone aligned through shared visibility. Pre-built templates help you start quickly. Out-of-the-box integrations ensure data flows seamlessly from existing platforms.
The content in this article is provided for informational purposes only and, to the best of monday.com’s knowledge, the information provided in this article is accurate and up-to-date at the time of publication. That said, monday.com encourages readers to verify all information directly.
Frequently asked questions
How often should product managers update their reports?
Product managers should update reports based on type and audience needs. Operational reports like sprint updates typically refresh weekly or bi-weekly. Strategic reports like roadmap reviews update monthly or quarterly.
Can report templates work for both Agile and traditional project management approaches?
Report templates adapt to any methodology by adjusting metrics and timeframes while maintaining core principles. Agile teams focus on velocity and sprint progress. Traditional teams track phase completion and milestones.
What tool integrations enhance product manager report automation?
Integrations with development tools, analytics platforms, and communication systems streamline data collection. Connecting to GitHub, Jira, Google Analytics, and Slack ensures data flows automatically into reports.
How do you secure sensitive product data in reporting templates?
Role-based access controls protect sensitive data when sharing reports. Define who can view specific fields or reports. Restrict confidential information like revenue projections to appropriate audiences.
Which metrics matter most for product manager stakeholder communication?
The most important metrics align with business objectives and vary by audience. Executives focus on strategic outcomes like revenue and market share. Teams focus on operational progress like velocity and completion rates.
How does AI improve product manager reporting accuracy?
AI improves accuracy by reducing human error in data analysis. It identifies patterns manual review might miss. Automated data collection and analysis result in more reliable insights and predictions.