

Shipping features is only half the battle. The other half is proving they deliver real value. When development work is disconnected from business outcomes, teams fly blind, priorities become unclear, and resources are wasted on initiatives that don’t move the needle. This gap between building and impact is where product backlogs grow and confidence shrinks.
A product management dashboard closes this gap. It acts as a command center, translating sprint velocity and cycle times into clear business metrics like feature adoption, customer satisfaction, and revenue impact. This shared view aligns engineering, business, and leadership teams, ensuring everyone works from the same playbook.
Whether you’re a product manager drowning in spreadsheets or a team leader struggling to connect development work to business outcomes, this guide gives you a practical roadmap to dashboard success.
Key takeaways
- Connect building to business impact: product dashboards give you real-time visibility into feature adoption, sprint velocity, and revenue impact in one place, bridging what your team builds with what your business achieves.
- Track five essential metrics: development velocity, feature adoption, customer satisfaction, revenue impact, and team alignment drive decisions that actually move the needle.
- Eliminate scattered data: customizable workflows integrate seamlessly with GitHub, Slack, and analytics platforms; solutions like monday dev let you consolidate information without forcing your team to change how they work.
- Leverage AI-powered insights: dashboards that automatically surface hidden opportunities and predict risks save teams 20–30% of their analysis time while catching important signals humans might miss.
- Design for action, not just insight: use thresholds, alerts, and color-coded indicators that tell teams exactly what to do next.
What is a product management dashboard?
A product management dashboard is a visual interface that consolidates your key product metrics, development progress, and business outcomes in a single, centralized location. It acts as your product’s command center, providing visibility into feature adoption, sprint velocity, customer satisfaction, and revenue impact all in one place.
Unlike basic project trackers that only display work items and deadlines, a product management dashboard connects what your team builds to the results your business achieves.
Not only does it show how a new feature release affects user engagement, but it also highlights when sprint delays could impact quarterly goals and identifies which customer feedback should guide your next priorities.
Why product teams need dashboards that drive real results
Product teams juggle constant demands: ship faster, prioritize smarter, prove impact. Without a clear view of what’s happening across development, customer feedback, and business metrics, you’re flying blind. Product dashboards solve this by creating one source of truth that keeps everyone aligned and surfaces problems before they derail your roadmap.
- Escape spreadsheet chaos: consolidate scattered data from spreadsheets, Slack, and disconnected tools into one real-time dashboard. Eliminate version confusion, align metrics, and spend less time searching for answers.
- Unite engineering and business vision: give both teams shared visibility into key metrics like adoption, velocity, and revenue impact. Align priorities, clarify trade-offs, and make data-driven decisions together.
- Accelerate decision-making with real-time data: gain instant insight into performance, spot issues early, and pivot quickly. Move from reactive problem-solving to proactive optimization.
5 essential metrics for your product dashboard
You could track dozens of metrics, but five core measurements form the foundation of effective product management. These connect daily work to business outcomes and help you focus on what actually moves the needle.
1. Development velocity and sprint health
Development velocity measures the amount of planned work your team completes within each sprint. Sprint health reflects consistency and indicates whether you are achieving sprint goals or frequently carrying work over to subsequent sprints.
- Story points per sprint: shows if your team’s capacity is stable or declining.
- Cycle time for user stories: reveals how long work actually takes versus estimates.
- Sprint goal achievement rate: indicates planning accuracy and team focus.
- Carryover tasks between sprints: highlights capacity or prioritization issues.
2. Feature adoption and user engagement
Feature adoption reveals whether your product investments deliver value. While high adoption validates your decisions, low adoption signals you need to revisit positioning or usability.
- New feature adoption within 30 days: shows if users discover and try new capabilities.
- Daily and monthly active users: tracks overall product health and growth.
- Session duration and depth: reveals how deeply users engage with your product.
- Time to first value: measures how quickly new users experience benefits.
3. Customer satisfaction and NPS tracking
Customer satisfaction metrics serve as early warning systems. High scores signal strong product-market fit. Declining scores highlight issues before they impact retention.
- NPS trends over time: shows if overall sentiment is improving or declining.
- CSAT scores by feature: pinpoints which areas delight or frustrate users.
- Support ticket volume: indicates product quality and user confusion.
- Churn rate and reasons: reveals why customers leave.
4. Revenue and growth impact
Revenue metrics connect product work directly to business outcomes. They help you justify investments and guide prioritization toward work that drives growth.
- Feature-driven revenue: attributes income to specific product investments.
- Trial-to-paid conversion: shows if your product delivers on its promise.
- Customer lifetime value: indicates long-term product value.
- Expansion revenue: reveals upsell and cross-sell success.
5. Team alignment and resource allocation
These metrics track how effectively your team works together and whether resources go to the right places. They directly address common challenges with prioritization and coordination, core concerns in product portfolio management.
- Capacity utilization per sprint: shows if teams are over or underloaded.
- Cross-team dependencies: reveals coordination bottlenecks.
- Resource allocation by initiative: ensures strategic priorities get proper support.
- Velocity trends over time: indicates team performance patterns.
Building blocks of high-impact product dashboards
High-impact product dashboards don’t just display data — they turn information into actionable insight. To truly support strategic decision-making, your dashboard needs a combination of visualization, integration, connectivity, and security. The following building blocks define dashboards that drive clarity, alignment, and measurable impact.
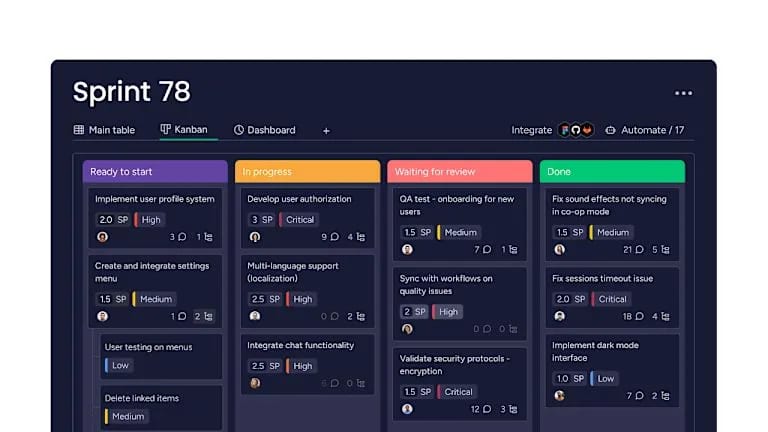
- Dynamic data visualization: interactive charts and graphs update automatically as new data flows in. Burndown charts show sprint progress. Heatmaps reveal feature engagement patterns. Funnel visualizations track user journeys. These views make complex information digestible at a glance.
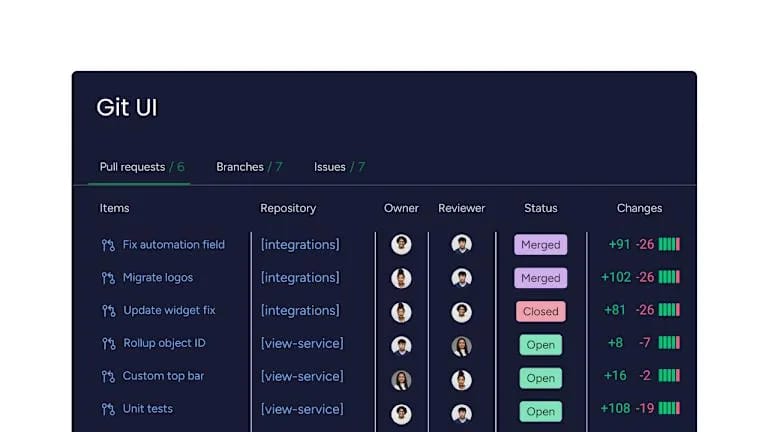
- Flexible workflow integration: your dashboard should connect seamlessly with development platforms like GitHub, communication channels like Slack, and analytics systems. Bi-directional data flow keeps everything in sync without manual updates. Platforms like monday dev excel here, letting teams customize integrations to match their exact workflow.
- Cross-platform connectivity: product dashboards must aggregate data from multiple sources like development platforms, analytics, support tickets, revenue data. This eliminates information silos and provides comprehensive visibility across the entire product lifecycle.
- Enterprise-grade security: when consolidating sensitive data, security becomes critical. Look for SOC2 compliance, role-based access controls, and audit logs. These features protect your data while enabling collaboration.
How to build your product management dashboard in 4 steps?
Building an effective product management dashboard requires more than assembling charts. It demands strategic alignment, thoughtful metric selection, and continuous refinement to ensure the dashboard drives meaningful decisions. The following four steps provide a practical framework for creating a dashboard that supports both day-to-day execution and long-term product strategy.
Step 1: map your product strategy to measurable goals.
Start by translating high-level objectives into specific metrics. “Increase user retention” becomes daily active users, feature engagement rates, and churn percentage. Get stakeholder alignment early: everyone should agree on what success looks like, which is where OKR product management can help.
Step 2: select metrics that matter.
Choose a balanced mix of leading indicators (like feature adoption) and lagging indicators (like revenue impact). Avoid metric overload by focusing on measurements that inform decisions. Start with the five essential metrics, then tailor your dashboard to your product stage.
Step 3: design for action not just insight.
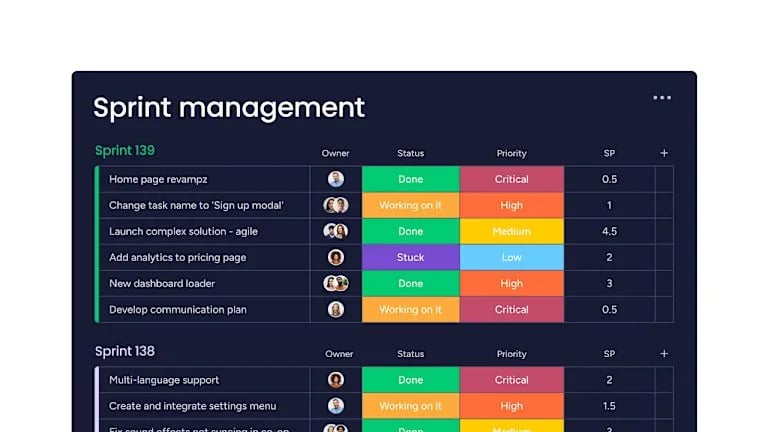
Structure your dashboard to prompt responses. Use thresholds, alerts, and trend indicators that signal when action is needed. Color-coded status indicators help teams quickly spot areas requiring attention. The goal is making your dashboard tell teams what to do next.
Step 4: launch and optimize continuously.
Launch with a minimum viable dashboard that covers core metrics, and treat it like a product you can refine over time. Iterate based on actual usage, tracking which views gain attention and which metrics spark discussion. Ongoing training ensures teams fully integrate the dashboard into their daily workflow.
Choosing dashboard products that scale with your team
Selecting the right dashboard platform goes beyond feature lists. As teams expand, project complexity increases, and data sources multiply, dashboards must remain flexible, secure, and collaborative. The following comparison highlights how different options support scalability and team productivity:
| Feature | Customizable dashboards | Rigid templates | monday dev platform |
|---|---|---|---|
| Layout flexibility | High | Low | High |
| Integration capabilities | Extensive | Limited | Extensive (dev platforms, CRM) |
| Security & compliance | Enterprise-grade | Basic | SOC2, SSO, RBAC |
| Collaboration features | Robust | Minimal | Real-time comments, sharing |
| Scalability | Startup to enterprise | Limited | Startup to enterprise |
| Automation & AI | Available | Rare | AI-powered analytics |
| Support for unique workflows | Yes | No | Yes |
- Flexibility over rigid templates: customizable dashboards adapt as your team evolves. A startup might prioritize rapid delivery and user growth. An enterprise needs portfolio visibility and compliance features. Flexible platforms let you adjust without waiting for vendor updates.
- Security and compliance essentials: enterprise teams need robust data governance. Look for single sign-on (SSO), role-based access control (RBAC), and audit logs. SOC2 compliance and data encryption protect sensitive information as you scale.
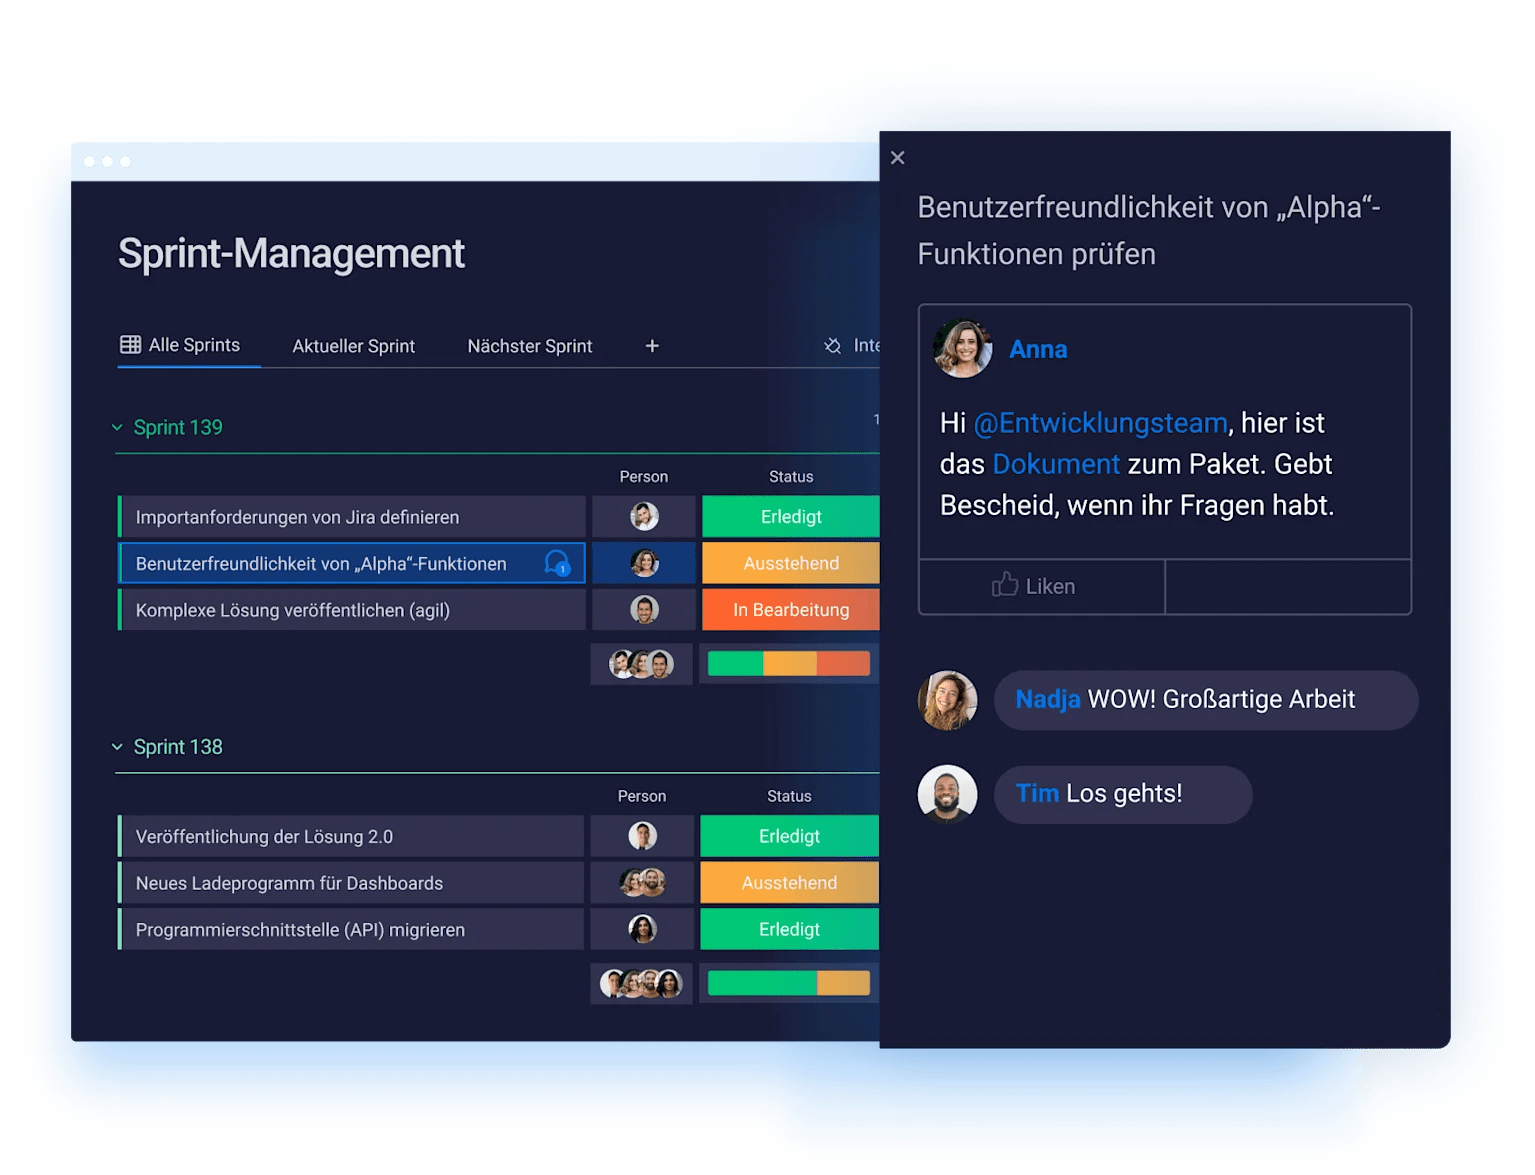
- Collaboration without compromise: effective dashboards enable seamless teamwork while maintaining data integrity. Real-time sharing, commenting, and filtered views keep teams aligned without risking unauthorized changes.

"monday dev empowered us to optimize our GTM approach, resulting in faster, more dependable deliveries"
Steven Hamrell | Director of Product Management
"monday dev empowers us to manage the entire development process on one platform so we can speed up product delivery and improve customer satisfaction"
Mitchel Hudson | Head of Technology
"We're operating in an open, deep trusting, transparent environment with no silos of information. It's about completely opening access to everyone who needs it."
Alan Schmoll | Executive Vice President, Vistra PlatformAI-powered product analytics dashboard revolution
AI transforms dashboards from reporting platforms into intelligent assistants. These capabilities give teams competitive advantages by surfacing insights humans might miss. According to a 2025 McKinsey report, CEOs in high-performing organizations are now using AI platforms to monitor regulatory filings, sanctions listings, and policy changes in real time, integrating these analytics into strategic planning and resource allocation decisions.
Automate portfolio analysis tasks
AI handles routine analysis like trend identification and anomaly detection. Instead of manually reviewing sprint data, AI flags unexpected drops in adoption or unusual cycle times. Teams save hours weekly and catch important signals.
For example, Palantir’s Q4 2023 earnings report highlighted a 70% year-over-year growth in U.S. commercial revenue, largely driven by demand for its Artificial Intelligence Platform (AIP) that powers real-time analytics for enterprise teams.
Unlock hidden opportunities in product data
AI identifies patterns across usage data, feedback, and performance metrics. It surfaces emerging user segments, underutilized features with potential, or optimization opportunities. Teams can prioritize based on insights they’d otherwise miss.
Predict and prevent product risks
Predictive analytics help teams anticipate problems. AI forecasts user churn, alerts to performance issues, or warns about resource constraints. Early warnings enable proactive responses before small issues become major problems.
Transform cross-team collaboration with smart dashboards
Modern dashboards solve collaboration challenges by creating shared understanding and empowering teams with self-service insights. When everyone sees the same information, more strategic decisions follow.
McKinsey reports that top-performing companies establish dedicated “nerve centers” and cross-functional foresight teams to continually scan the environment and pressure-test strategy, capital allocation, and scenario planning, embedding these insights into their planning processes.
- Bridge technical and business teams: dashboards translate between technical metrics and business impact. Unified reporting maps feature delivery to revenue growth. Both audiences understand how daily work connects to strategic goals. This shared visibility prevents costly misalignment.
- Enable managers without creating bottlenecks: self-service analytics give managers visibility without interrupting developers. Real-time data and on-demand reports maintain transparency while preserving team autonomy. Managers spot issues early without adding overhead.
- Foster data-driven culture: accessible dashboards encourage everyone to use data in decisions. Teams develop shared language around metrics. Discussions become more productive. Data-driven thinking becomes embedded in how teams work.
The product dashboard platform built for how you work: monday dev
The right dashboard platform doesn’t force you to change how your team works; it adapts to your existing processes while giving you the flexibility to evolve. With monday dev, you get customizable workflows, seamless integrations, and enterprise-grade security that grows with your team, whether you’re a five-person startup or a global organization.
- Customize workflows your way: design workflows matching your process rather than adapting to rigid templates. Create custom dashboards for sprint planning, feature tracking, or feedback analysis. Teams spend less time fighting their platform and more time shipping product.
- Connect everything without complexity: monday dev integrates with GitHub, Slack, analytics platforms, and more. Automated workflows keep information flowing between systems. This connectivity eliminates context switching and keeps teams focused.
- Scale from startup to enterprise: start small with basic boards, then add users and integrations as you grow. SOC2 compliance, SSO, and robust APIs ensure security scales with your needs. You won’t outgrow the platform or face disruptive migrations.
Turn your product vision into measurable success
Delivering features is only part of the challenge; showing that they create real business value is what sets high-performing teams apart. A product dashboard turns raw data into a clear view of progress, adoption, and outcomes, helping teams understand which initiatives drive results and which need adjustment.
By connecting development work to measurable business metrics, dashboards foster alignment across engineering, product, and leadership. Everyone can see the same priorities, respond quickly to risks, and make informed decisions without relying on spreadsheets or fragmented reports.
The right platform empowers teams to act with confidence. With real-time insights, actionable alerts, and AI-driven analysis, product managers can identify opportunities, optimize workflows, and demonstrate impact consistently—turning data into decisions that propel growth.
The content in this article is provided for informational purposes only and, to the best of monday.com’s knowledge, the information provided in this article is accurate and up-to-date at the time of publication. That said, monday.com encourages readers to verify all information directly.
Frequently asked questions
What’s the difference between a product dashboard and project management dashboard?
Product dashboards measure outcomes (are we building the right thing?), whereas project dashboards measure outputs (are we building things on schedule?). For a deeper look, read project management vs product management.
How frequently should product dashboards refresh data?
Most product dashboards refresh operational metrics in real time or near real time, while strategic metrics update daily or weekly. Sprint velocity might update hourly during active development, while monthly revenue metrics update after accounting closes.
Can AI-powered dashboards work with existing tools?
Modern AI-powered dashboards integrate with existing development platforms, analytics systems, and data sources through APIs and connectors. This maximizes your current platform investments without requiring teams to switch systems.
What’s the typical ROI of implementing product dashboards?
Organizations typically see faster decision-making, reduced manual reporting time, and improved product outcomes. Many teams report 20–30% time savings on analysis tasks and more confident prioritization decisions.
How do you ensure dashboard adoption across teams?
Successful adoption requires involving team members in dashboard design, providing relevant training, and demonstrating clear value. Dashboards that solve real problems, like eliminating status meetings or surfacing issues early, achieve sustained adoption.
Which dashboard metrics matter most for SaaS products?
SaaS products should prioritize user engagement metrics, feature adoption rates, customer satisfaction scores, and revenue impact measurements. These metrics help balance acquiring new customers with retaining and expanding existing accounts.