

Engineering productivity is the ability of your software engineering teams to turn time, skills, and tools into customer and business value — not just ship code faster.
The goal is to understand whether your organization is reliably delivering the right outcomes, not simply increasing outputs like lines of code or tickets closed.
In this guide, you’ll learn the most important engineering productivity metrics, how to measure them in practice, and how monday dev helps you track and improve them across your sprints.
Try monday devKey takeaways
- Engineering productivity is about outcomes — reliable, valuable software that moves the business forward — rather than activity or velocity alone.
- Focusing on a small set of engineering productivity metrics, such as cycle time, deployment frequency, and change failure rate, gives a clearer picture of how work flows.
- Measuring engineering productivity effectively requires a repeatable process: define goals, select metrics, centralize data, review regularly, and iterate on your workflows.
- Harnessing AI capabilities and platform engineering practices improves productivity without sacrificing developer experience.
- Centralizing sprint boards, GitHub data, and collaboration into a single platform, like monday dev, makes measuring engineering productivity far easier than juggling spreadsheets and disconnected tools.
What is engineering productivity?
Engineering productivity measures how effectively software engineering teams convert time, skills, and tools into high‑quality outcomes that advance business goals.
It balances engineering effectiveness — removing bottlenecks and friction from daily work — with speed (shipping valuable work quickly), quality (few defects, stable systems), collaboration (smooth cross‑team workflows), reliability, and developer experience.
In practice, teams track engineering efficiency metrics such as cycle time, defect rates, deployment frequency, team satisfaction, and collaboration quality to understand and improve this balance.
Why measuring engineering productivity matters
Engineering teams face intense pressure to deliver more value, faster, in a market shaped by global competition and rapidly evolving AI capabilities. Without measuring engineering productivity, leaders cannot see where time and effort are lost, which improvements work, or how engineering contributes to revenue, customer experience, and risk reduction.
Thoughtful use of software engineering productivity metrics, such as cycle time, deployment frequency, MTTR, and change failure rate, turns that pressure into actionable insight. This enables data‑driven decisions and transparent communication with executives and stakeholders.
How to measure engineering productivity in 5 steps
Measuring engineering productivity works best when it follows a simple, repeatable process that teams can trust and improve over time.
Step 1: Define what productivity means for your organization
Clarify whether you care most about throughput, quality, reliability, innovation, or specific business outcomes like revenue and customer satisfaction. Align leadership and teams on this definition so that later software engineering productivity metrics are interpreted consistently, not in isolation.
Step 2: Choose a focused set of engineering productivity metrics
Select a small, balanced set of metrics, such as cycle time, deployment frequency, planning accuracy, unplanned work ratio, and key DORA/SPACE indicators. Avoid tracking everything — focus on a handful of metrics that directly reflect your goals and can realistically inform decisions.
Step 3: Centralize engineering data in one platform
Connect work items, code hosts (such as GitHub), and deployment tools so planning and delivery data live in a single platform. For instance, the monday dev GitHub integration and engineering performance dashboard consolidate these signals, eliminating spreadsheet exports and fragmented reporting.
Step 4: Visualize metrics in dashboards and review them regularly
Use sprint views, burndown charts, Agile insights, and sprint performance widgets to turn raw data into clear, team-friendly visuals. Build quick-review rituals into Agile ceremonies, such as daily standups and sprint retros, so teams spot bottlenecks early and treat metrics as a shared feedback loop, not a surprise report.
Step 5: Iterate on process and link changes to business value
When a metric moves, adjust workflows, staffing, or priorities, then check whether time-to-market, incident rates, or customer satisfaction improved. Over time, this closed-loop — measure, experiment, review, repeat — builds a culture where engineering productivity improvements are both sustainable and clearly tied to outcomes.
4 common mistakes when measuring engineering productivity (and how to avoid them)
Many teams start measuring engineering productivity with good intentions, but a few common pitfalls can quietly undermine their efforts and damage trust in the process. Here’s what to look out for and avoid.
1. Treating activity as impact
Over‑indexing on activity metrics like lines of code, commits, or tickets closed can encourage busyness instead of value, and is easy to game.
How to fix: Balance them with outcome‑oriented indicators such as cycle time, customer-impacting releases, incident rates, and business KPIs to see the real picture.
2. Ignoring developer experience and burnout
Focusing only on speed and deadlines while overlooking workload, context switching, and on‑call load can drive burnout and lower long‑term productivity.
How to fix: Pair delivery metrics with developer satisfaction surveys, sustainable pacing, and time reserved for tech debt so improvements don’t come at the team’s expense.
3. Measuring individuals instead of teams and systems
Using individual productivity scores can undermine collaboration, foster information hoarding, and mask systemic bottlenecks.
How to fix: Measure engineering productivity at the team or value‑stream level, focusing on shared outcomes, handoffs, and flow efficiency across the entire delivery pipeline.
4. Tracking metrics without changing anything
Collecting dashboards and reports but never experimenting with process, staffing, or priorities turns metrics into noise.
How to fix: Set explicit hypotheses like “shorter review queues will reduce cycle time.” Then, run small changes, and revisit your metrics regularly to confirm whether they actually improved engineering productivity.
AI and the future of engineering productivity
AI is reshaping engineering productivity by taking over repetitive tasks, accelerating analysis, and helping teams focus on higher‑value work. Studies show AI assistants can boost certain coding tasks by 20–40% and improve documentation and review quality, though gains vary by team, codebase, and workflow.
For software leaders, the opportunity lies in pairing AI capabilities with clear engineering productivity goals and metrics rather than treating AI as a silver bullet.
That means measuring AI’s impact using software engineering productivity metrics (e.g., cycle time, deployment frequency, and defect rates) alongside adoption, satisfaction, and cost, to see where AI genuinely lifts outcomes rather than just shifting bottlenecks.
Remember: Teams that pair AI adoption with clear measurement avoid mistaking faster output for real engineering effectiveness.
Platform engineering for enhanced productivity
Platform engineering boosts engineering productivity by giving teams a consistent, self‑service way to build, test, and ship software without wrestling with infrastructure and ad‑hoc tooling. Internal developer platforms standardize workflows, automate provisioning and deployments, and reduce cognitive load, so engineers spend more time delivering value and less time on repetitive setup work.
As systems and AI-assisted workflows grow more complex, platform teams become critical enablers of engineering effectiveness. They integrate signals from repositories, CI/CD, runtime, and AI tools into a unified platform, making it easier to track engineering productivity metrics, identify friction points, and connect platform investments to business outcomes such as faster time-to-market and higher developer satisfaction.
7 ways to improve engineering productivity
Improving engineering productivity rarely comes from one significant change. Productivity gains emerge from consistent, minor adjustments to how teams plan, build, and operate software.
- Improve sprint planning accuracy: Use historical data to set realistic commitments and avoid overloading teams, so work finishes predictably instead of spilling into future sprints.
- Shorten cycle time with better code review visibility: Standardize review practices, keep pull requests small, and monitor review queues to prevent work from stalling for feedback.
- Reduce unplanned work through clearer stakeholder alignment: Maintain a shared roadmap and transparent backlog so stakeholders understand trade‑offs and minimize last‑minute “urgent” requests.
- Protect focus time and cut context switching: Limit concurrent projects, reduce unnecessary meetings, and consolidate where work is tracked to give engineers long, uninterrupted blocks for deep work.
- Invest steadily in technical debt reduction: Reserve a fixed percentage of each sprint for refactoring, test coverage, and reliability tasks so code quality improves alongside feature delivery.
- Strengthen incident response and recovery: Track MTTR and change failure rate, refine on‑call processes and runbooks, and ensure post‑incident actions feed back into planning and prioritization.
- Use AI‑driven insights to spot bottlenecks early: Apply AI and analytics to categorize work, detect patterns such as chronic over‑commitment or slow reviews, and highlight where process changes will have the most significant impact.
Engineering productivity tools and how to choose the right software
Selecting engineering productivity tools is easier when you use a simple, repeatable framework rather than chasing individual feature checklists.
- Start with clear goals: Define what you want to improve — planning, delivery speed, reliability, code quality, or developer experience — so you can focus on tools that influence those outcomes, not vanity metrics.
- Map goals to tool categories: Connect each goal to categories like project/roadmap management, CI/CD and DevOps automation, observability and incident management, or engineering analytics, to avoid buying overlapping tools that do the same thing.
- Evaluate tools on consistent criteria: For each candidate (e..g, work management platforms, engineering analytics products, DevOps or observability suites), assess integrations with your stack, data coverage across repos and pipelines, visualization of software engineering productivity metrics, implementation effort, and usability in daily workflows.
- Prioritize platforms that reduce fragmentation: Favor tools that centralize key signals like work items, code, deployments, incidents into coherent dashboards so you can see trends and run experiments without juggling multiple systems.
- Keep specialized tools where they add unique value: Use CI/CD services, observability tools, and dedicated engineering analytics platforms where they provide depth, but anchor them around a platform that makes it easy to connect data, attribute changes in productivity, and communicate results to stakeholders.
How monday dev accelerates engineering productivity
Built on monday.com Work OS, monday dev accelerates engineering productivity by bringing planning, delivery, and GitHub activity into one connected workspace, so teams can see how work flows from engineering roadmap to production in real time.
Instead of stitching together boards, spreadsheets, and CI logs, engineering leaders get a clear view of sprint health, bottlenecks, and improvement opportunities in a single place.
Turning sprint history into actionable insights
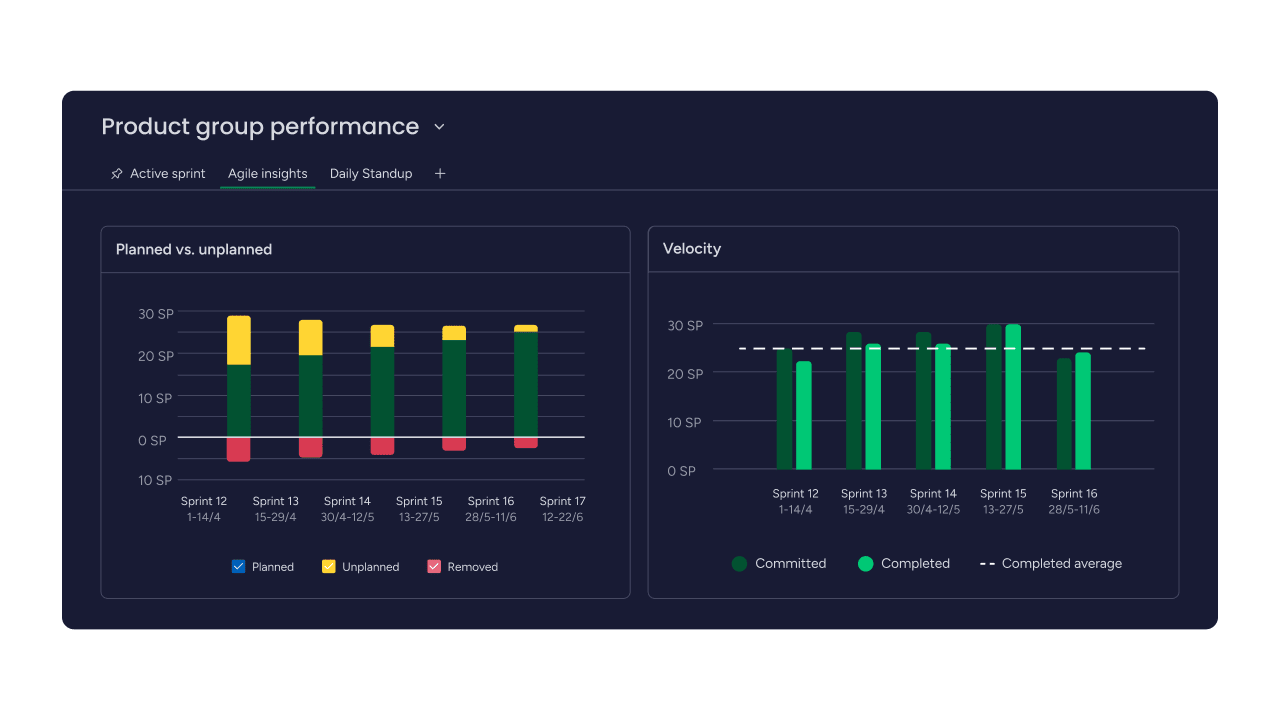
With the Agile Insights board view, monday dev turns sprint history into charts like “Velocity” and “Planned‑vs‑unplanned work,” making it easier to improve planning accuracy and forecast capacity. Teams can see whether they consistently over-commit, how often unplanned work derails sprints, and how these patterns affect delivery reliability over multiple iterations.
Seeing pull‑request flow and cycle time clearly
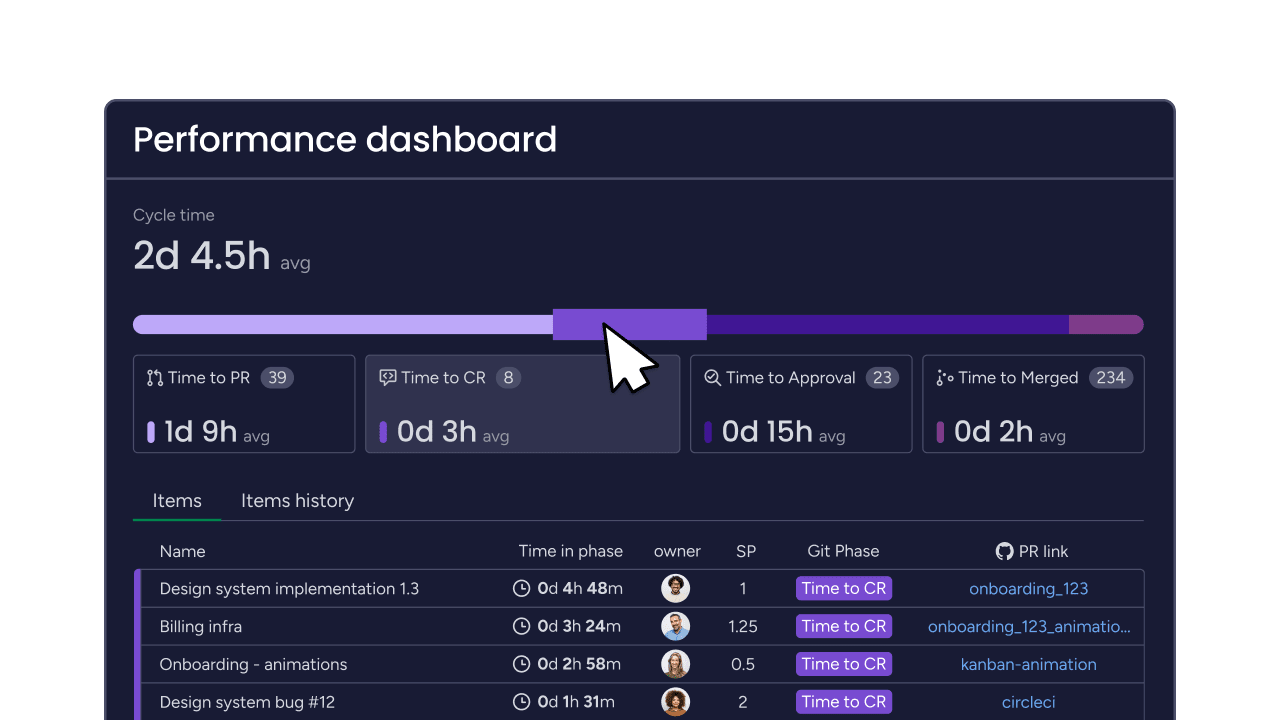
The Engineering Performance Dashboard and Sprint Performance Widget link sprint items to GitHub pull requests, giving real‑time visibility into cycle time and review flow. By tracking metrics such as time to PR, time to code review, and time to merge, monday dev helps teams identify where work is getting stuck in the pull‑request lifecycle and take targeted action to reduce delays.
Connecting engineering work to business outcomes
Because monday dev sits on top of the monday.com Work OS, it also connects engineering work with product roadmaps and business stakeholders. Roadmap tracking, epic breakdowns, and customizable dashboards make it easier to link engineering productivity metrics — such as throughput and cycle time — to feature delivery, cross‑team dependencies, and, ultimately, to business outcomes that leaders care about.
Using AI-powered insights on top of your data
AI in monday dev helps teams analyze board and sprint data faster by summarizing patterns, categorizing work, and highlighting outliers that might signal bottlenecks or risk. Instead of manually combing through dashboards, engineering leaders can use AI-generated insights and suggestions as a starting point for decisions about scope, staffing, and process changes that improve engineering productivity.
Start your 14-day free monday dev trial and see how you can measure engineering productivity across your sprints in real time.
Try monday devFAQs
How do you calculate engineering productivity ROI?
Engineering productivity ROI compares the business value delivered by engineering work to the cost of delivering it. Start by estimating revenue impact, cost savings (e.g., automation, reduced incidents), and risk reduction. Then divide those gains by total engineering investment (salaries, tooling, infrastructure). Tools with integrated dashboards, like monday dev, make it easier to track these metrics over time.
What's the difference between velocity and productivity in engineering?
Velocity measures how much scoped work a team completes within a timebox, typically in story points per sprint. Productivity refers to how efficiently and effectively work creates value, including quality, reliability, and outcomes. A team can have high velocity but low productivity if work frequently causes defects, rework, or misaligned features.
How often should engineering teams review productivity metrics?
Engineering teams should review key metrics frequently enough to inform decisions without creating reporting overhead. Many teams inspect operational metrics (cycle time, deployment frequency) weekly and discuss trends in each sprint retro. Leadership can review higher‑level engineering productivity and ROI quarterly to guide investment, headcount, and platform decisions.
Can AI coding tools replace traditional productivity measurement?
AI coding tools can boost productivity by speeding up tasks like code generation, refactoring, and documentation, but they cannot replace measurement. Their impact still needs to be evaluated through established engineering productivity metrics such as cycle time, defect rates, and deployment frequency. Platforms like monday dev help track these outcomes so you can quantify AI’s real value.
What productivity metrics matter most for remote engineering teams?
For remote teams, metrics should balance delivery, quality, and collaboration. Practical measures include cycle time, deployment frequency, change failure rate, and mean time to recovery, paired with indicators such as code review turnaround time, incident response speed, and developer satisfaction. Visibility across time zones through shared dashboards (for example, in monday dev) helps teams act on these signals.
How do you measure productivity without creating developer burnout?
Avoid using metrics to police individuals; instead, measure team‑level outcomes and system efficiency. Focus on balanced indicators (throughput, quality, stability, satisfaction) and review them collaboratively in retrospectives, inviting engineers to shape the metric set. Use data to remove bottlenecks, reduce unnecessary meetings, and cut toil — not to increase pressure or unsustainable workloads.