

Software teams often look productive on paper — tickets are moving, code is shipping, and meetings are happening. Yet deadlines still slip, priorities blur, and it’s hard to tell whether all that motion adds up to real progress.
That’s where Agile metrics change the story. Instead of just counting tasks, the right metrics reveal how work truly flows — how quickly ideas turn into value, where friction hides, and how predictably your team can deliver.
In this guide, we’ll explore 15 Agile metrics every modern team should track, from sprint velocity to cycle time. You’ll learn how to use them to spot bottlenecks early, balance speed with quality, and keep engineering aligned with business outcomes. The goal: turn your data into insight, and your insight into consistent delivery.
Key takeaways
- Start small: begin tracking with three to five core metrics that address your biggest problems, such as using velocity for planning and cycle time for spotting bottlenecks. Avoid creating confusion with too many measurements.
- Focus on flow: prioritize flow metrics (cycle time, throughput, lead time) to clearly identify where work gets stuck, which reveals hidden process problems and accelerates delivery.
- Automated insights: platforms like monday dev automate metric tracking, eliminates manual data entry, and creates real-time dashboards with AI-powered insights, ensuring metrics are useful for daily decisions and strategic planning.
- Measure value, not activity: use metrics to align engineering work with business value and customer satisfaction, rather than simply tracking activity, to prove your team’s strategic worth to the organization.
- Avoid metric gaming: prevent gaming by emphasizing long-term trends over single targets, using multiple complementary metrics, and celebrating organizational learning and continuous improvement.
What are Agile metrics?
Agile metrics are measurements that track how well your development team performs and delivers value. They’re numbers that tell you if your team is working efficiently, meeting deadlines, and building what customers actually need.
Agile metrics function as the dashboard for your development process. They provide crucial readouts on speed, fuel level, and engine health, allowing you to make smart, informed decisions while navigating a project. These metrics help you effectively steer your development projects in the right direction.
Agile metrics vs traditional project metrics
Traditional project metrics focus on predictability. They track whether teams stay on schedule and within budget based on plans made months in advance.
Agile metrics measure something different — how fast teams can deliver working software and adapt when priorities change.
Key differences include:
- Traditional metrics: measure adherence to the plan and predefined scope.
- Agile metrics: measure how effectively teams deliver value and respond to change.
- Traditional reporting: occurs at major project milestones.
- Agile reporting: happens continuously throughout development.
Key components of effective Agile metrics
Good Agile metrics share specific qualities that make them useful for your team. They need to be measurable, relevant, and actionable, aligning with Agile principles, otherwise you’re just collecting numbers without purpose.
The most effective metrics directly connect to your goals and reflect Agile values, helping you make decisions. If a metric doesn’t lead to action, it’s probably not worth tracking. Here’s what makes metrics truly valuable:
- Measurable: based on real data, not opinions.
- Relevant: directly tied to team or business goals.
- Actionable: leads to specific improvements.
- Transparent: everyone understands what’s being measured.
- Aligned: supports Agile values like collaboration and adaptation.

Why does every Agile team needs metrics?
Agile isn’t just about working faster — it’s about learning faster. To make that possible, teams need visibility into how work moves, where time goes, and how each sprint contributes to broader goals.
Metrics provide that visibility. They show whether your team’s effort is driving real progress, help you catch issues before they escalate, and ensure your delivery pace supports Agile budgeting goals.
The right metrics turn everyday work into insight, helping you improve flow, make informed decisions, and align technical execution with business strategy.
Identifying bottlenecks and improving flow
Bottlenecks slow down your entire team. Maybe code reviews take too long, or testing creates a backlog. Without metrics, these problems stay hidden until they cause missed deadlines.
Flow metrics like cycle time are among the engineering metrics that show you exactly where work gets stuck. Once you spot the bottleneck, you can fix it and speed up delivery for everything that follows.
Making data-driven decisions
Metrics are powerful, but their misuse can actually harm a well-meaning team’s efforts. Understanding these pitfalls is crucial to ensuring your measurements help rather than hurt your progress.
Modern solutions like monday dev play a critical role here by helping teams move from guessing to knowing. Such platforms automatically track key metrics and present them in clear Agile dashboards. This automated visibility transforms how teams plan and execute their work, ensuring metrics are a benefit, not a burden
Aligning engineering with business strategy
Development teams often work in isolation from business goals. Metrics bridge this gap by showing how technical work translates to business value.
When everyone sees the same metrics, conversations change. Instead of arguing about technical details, teams discuss which work delivers the most customer value in Agile product management contexts.
15 essential Agile metrics for peak performance
These 15 metrics provide a holistic view of your software delivery pipeline. They are carefully selected to cover the three critical dimensions of modern Agile development: speed (predictability and flow), quality (stability and testing rigor), and value (team health and customer satisfaction).
Understanding all three dimensions is key to achieving peak, sustainable performance.
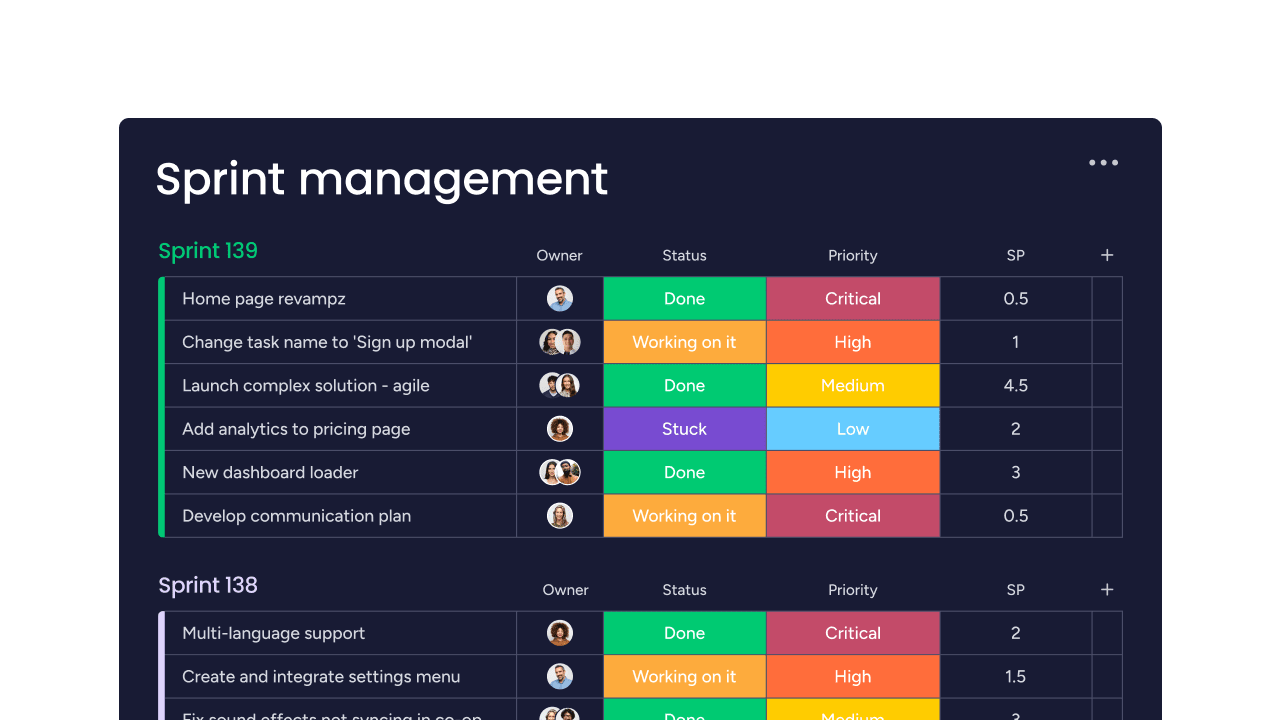
1. Sprint velocity
Scrum metrics like velocity measure the predictable delivery pace of a Scrum team. It is the total number of story points a team completes in an average sprint. Represents your team’s average delivery pace over time.
- Example: essential for Agile planning and forecasting future sprint commitments.
- Consideration: velocity is unique to each team’s estimation style and should never be used for comparing different teams.
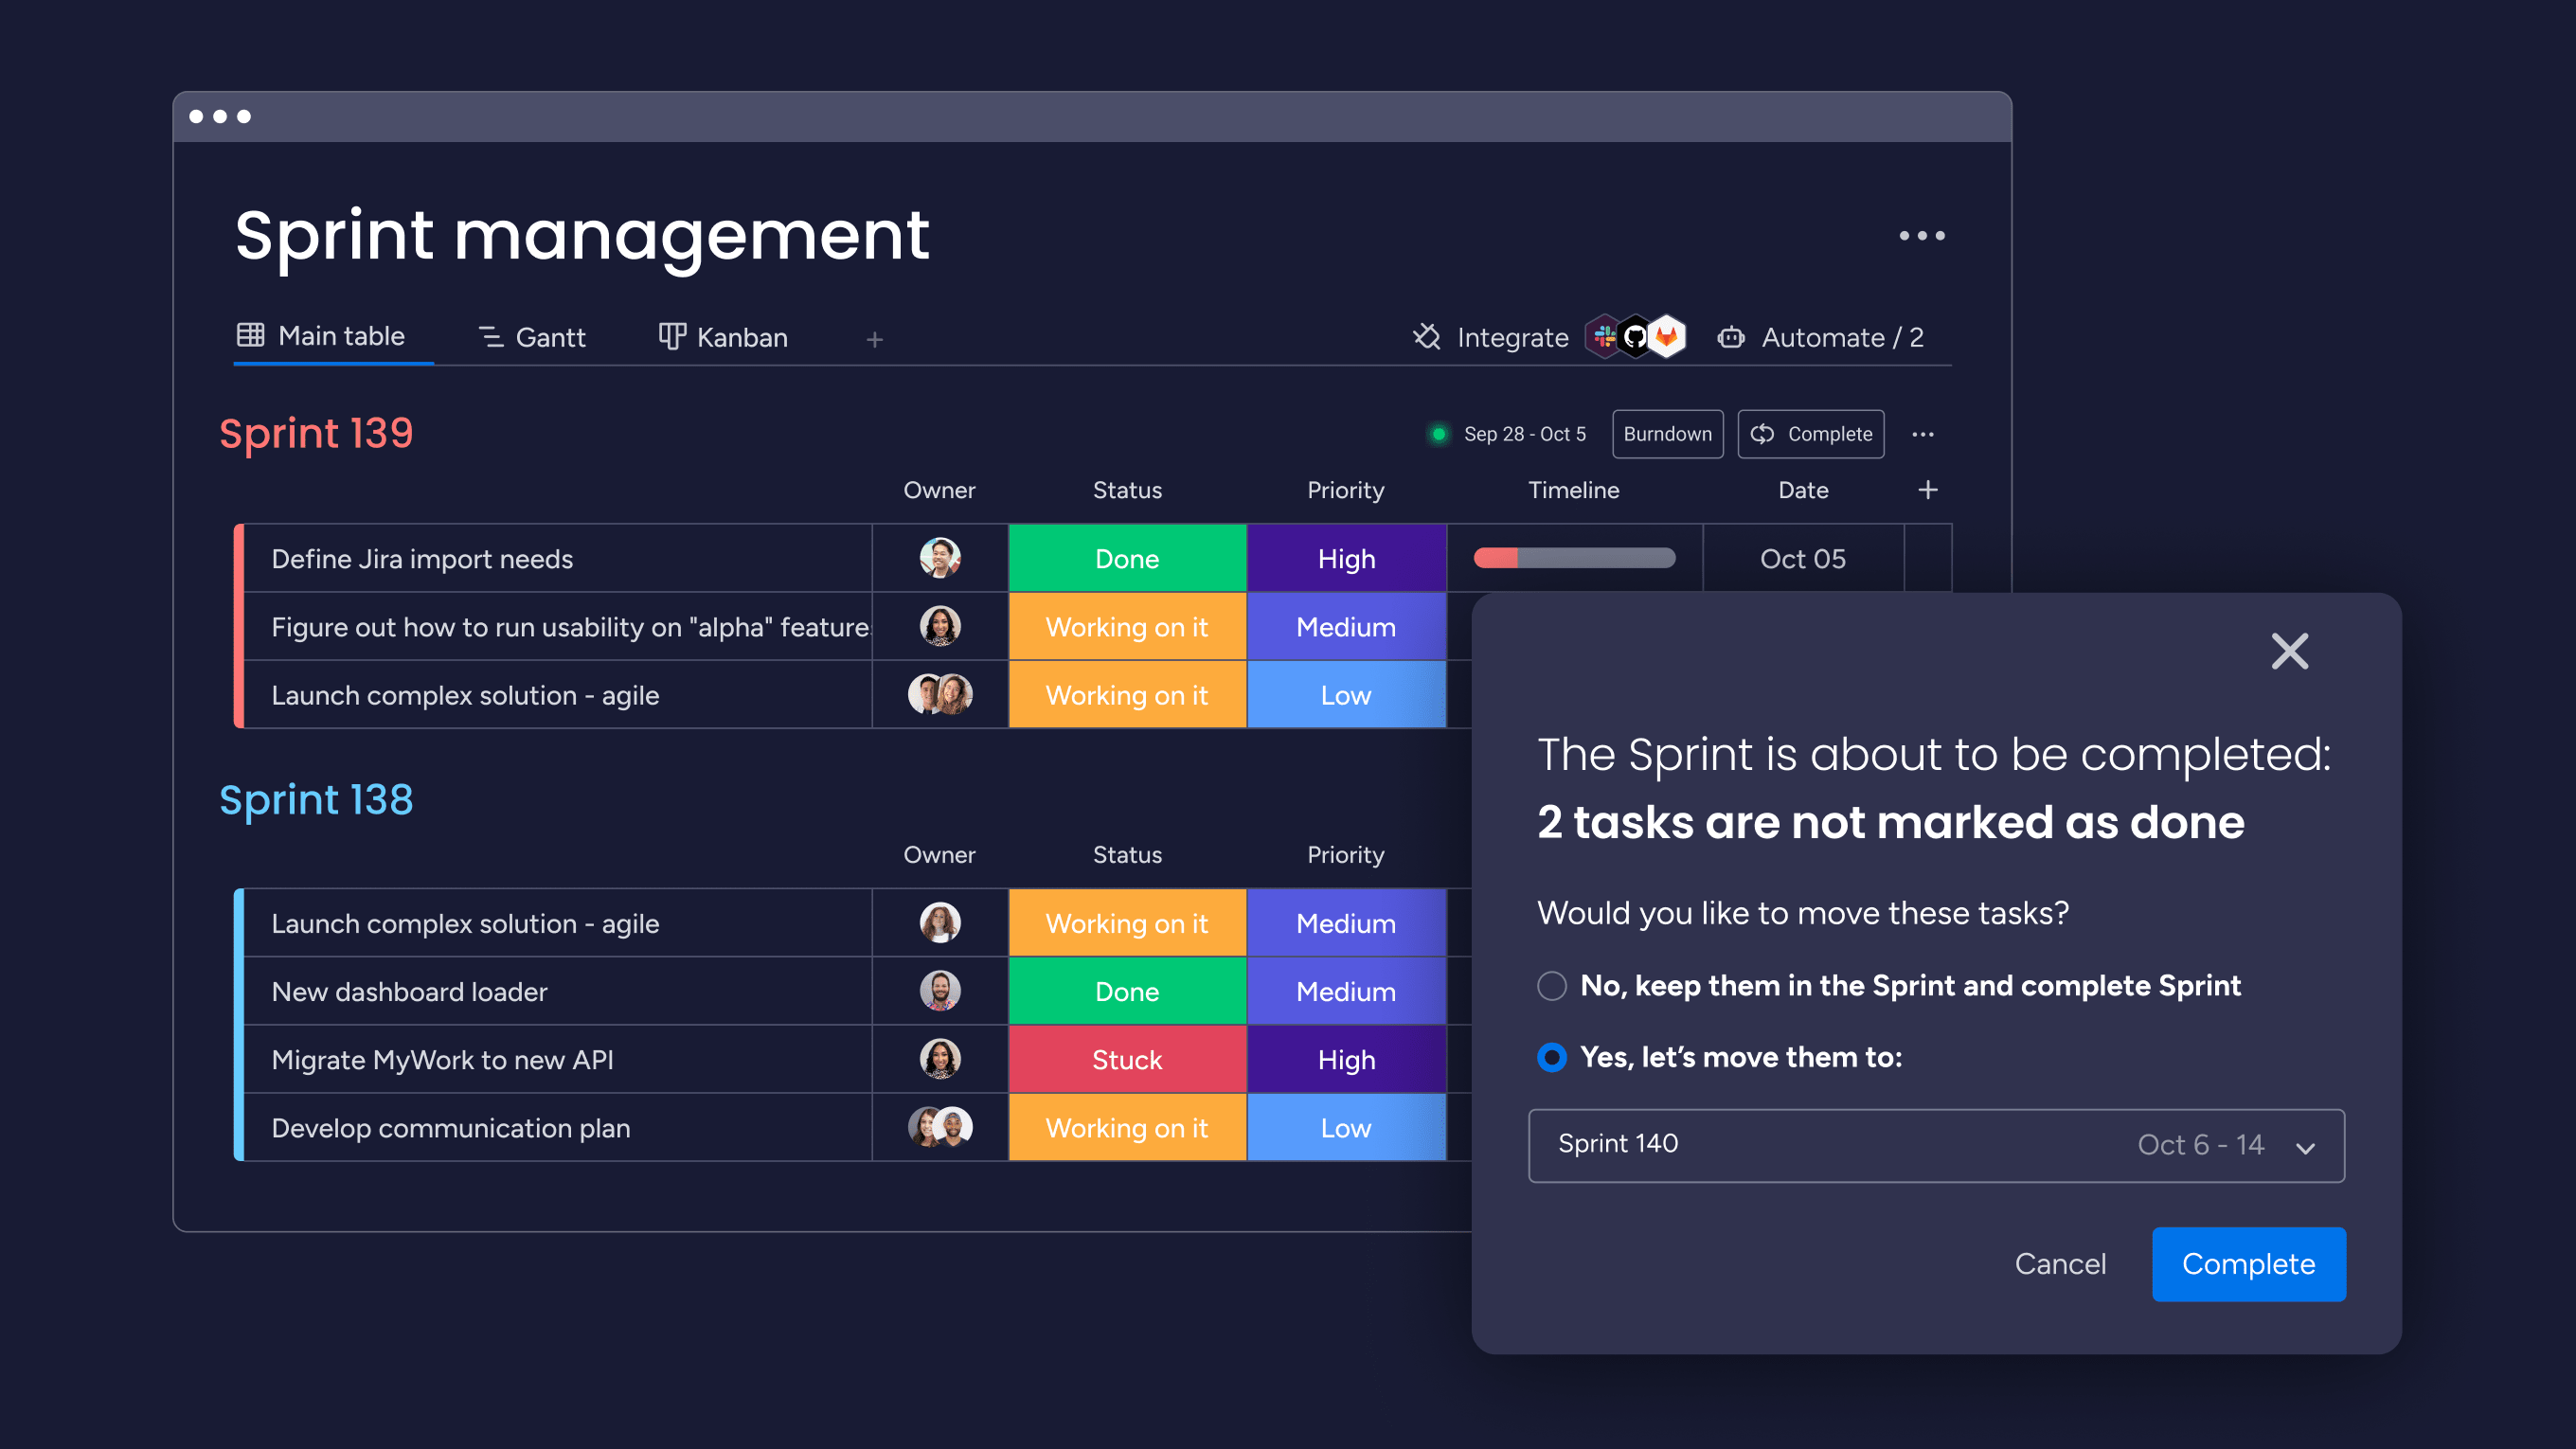
2. Sprint burndown
This chart visualizes the work remaining versus the ideal path to completion within a single sprint. Provides an immediate warning if the team is falling behind schedule.
- Example: keep the chart highly visible during stand-ups to guide daily decisions.
- Consideration: the actual progress line should ideally stay below or close to the ideal progress line.
3. Release burndown
Release burndown extends the concept of tracking remaining work across multiple sprints toward a major product milestone. Helps stakeholders instantly understand the probability of hitting the final release date.
- Example: use the chart to show the direct impact of scope changes on your timeline.
- Consideration: this metric requires a stable, well-groomed backlog for accurate long-term forecasting.
4. Cycle time
Cycle time measures the time elapsed from when work begins (“in progress”) until it is completed (“done”). Shorter cycle times mean faster feedback and quicker value delivery to the customer.
- Example: track this metric to spot process improvements and identify non-value-added waiting time.
- Consideration: focus on reducing the variance in cycle time for better predictability.
5. Lead time
Lead time includes everything from initial request to final delivery, encompassing all wait and work time. Reveals how responsive your entire system is to new customer requests.
- Example:use this metric to justify reducing Work In Progress (WIP) and streamline the intake process.
- Consideration: lead time will always be greater than Cycle Time, as it includes the waiting queue.
6. Throughput
Throughput is a measure of quantity, counting how many items are completed in a given time period. Stable throughput indicates a highly predictable and reliable delivery system.
- Example: monitor the consistency of this metric across periods to spot process stability issues.
- Consideration: unlike velocity, throughput does not care about the size of the item, only its completion.
7. Work in progress limits (WIP)
WIP limits are a critical constraint that caps the number of items that can be active at any one time. Monitoring WIP helps maintain a smooth and sustainable flow of work.
- Example: teams that respect WIP limits typically deliver work faster and produce fewer defects.
- Consideration: while a constraint, monitoring the system’s adherence to the limit acts as a critical health metric
8. Flow efficiency
Flow efficiency is a percentage showing how much time work spends in active development versus waiting or being idle. Reveals the true efficiency of your entire end-to-end value stream.
- Example: identify where work sits idle the longest and target those waiting states for improvement.
- Consideration: most teams discover their flow efficiency is surprisingly low, making it a high-leverage metric for improvement.
9. Escaped defects
Escaped defects are bugs that manage to bypass all quality gates and ultimately reach the production environment. Represents a failure in your testing, review, and quality assurance processes.
- Example: track these defects to justify investment in Agile testing and code reviews.
- Consideration: the cost to fix an escaped defect is significantly higher than fixing one caught during development.
10. Defect removal efficiency
DRE compares the number of bugs caught before release to the total number of bugs found (pre- and post-release). A high DRE confirms that your internal quality processes are working effectively.
- Example: use DRE to ensure you maintain a good balance between delivery speed and product quality.
- Consideration: a low DRE indicates testing is inadequate and customers are finding most of your bugs.
11. Code coverage
Code coverage is a measurement of what percentage of your codebase is covered by automated unit tests. Provides a strong indicator of testing thoroughness and the stability of your safety net.
- Example: focus testing resources on covering critical paths and high-risk core functionality.
- Consideration: do not chase 100% coverage; it is not economical and doesn’t guarantee the code is actually bug-free.
12. Team happiness index
This qualitative metric measures team morale and psychological safety, which directly impacts performance. Teams with high levels of psychological safety consistently perform better across technical metrics.
- Example: use quick, regular surveys to catch issues with workload, process, or team dynamics while they are easily fixable.
- Consideration: this metric is a leading indicator for problems that would otherwise manifest as declining velocity or rising defects.
13. Customer satisfaction score
CSAT connects your development work directly to external customer happiness and feature utility. Shows whether the features you built actually solve the customer’s problems effectively.
- Example: regular customer feedback keeps the team grounded and focused on building what delivers genuine value.
- Consideration: CSAT is a point-in-time satisfaction metric, typically tied to a specific recent interaction or feature.
14. Net promoter score
NPS asks customers how likely they are to recommend your product, capturing overall product health. A high NPS indicates you are building something customers love and advocate for.
- Example: use a low score to signal the need for fundamental strategy or product changes.
- Consideration: this is a long-term loyalty metric, not directly tied to a single feature release.
15. Business value delivered
This is the ultimate metric, quantifying the actual business impact of your work (revenue, costs saved, or efficiency gained). It proves your team’s direct financial and strategic value to the larger organization.
- Example: tracking business value helps the organization prioritize future work for maximum return.
- Consideration: requires close collaboration with the business and product owners to define and quantify the value of each feature.
How to track Agile metrics effectively
Effective tracking means making metrics visible and actionable without creating overhead. The best approach integrates measurement into your existing workflow.
Advanced platforms like monday dev streamline metric tracking by automatically collecting data as you work. This eliminates manual tracking while providing real-time insights for Agile software development.
Sprint burndown charts
Creating useful burndown charts requires consistent estimation and daily updates. The chart should be visible during stand-ups to guide daily decisions.
A burndown chart tells a story about your sprint’s progress, and learning to read it is key. By watching for a few common patterns, you can quickly diagnose issues and get the sprint back on track.
- Flat line: no progress meaning that something’s blocking the team.
- Steep drops: work completed in batches rather than steadily.
- Line going up: scope creep adding work mid-sprint.
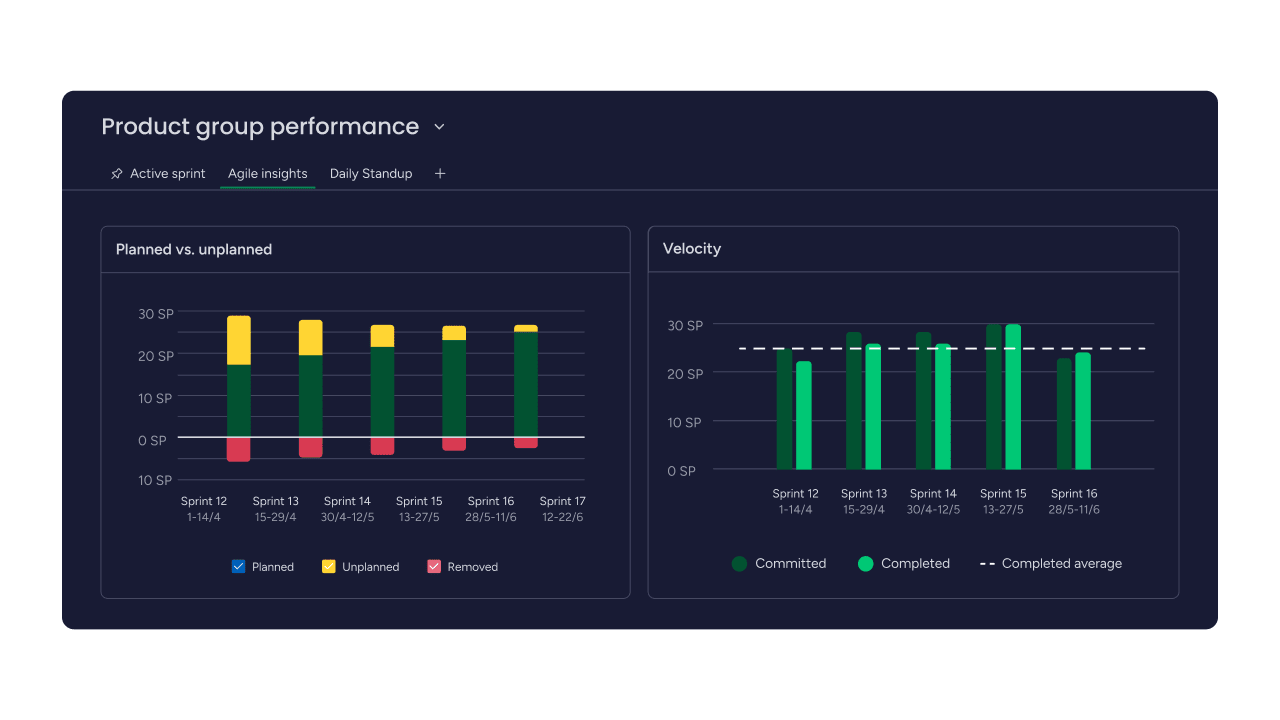
Velocity charts
Track development velocity across multiple sprints to accurately spot long-term trends. Since single-sprint variations are common and normal, do not overreact to them; focus instead on identifying consistent patterns over time.
You can use rolling averages to smooth out these natural fluctuations. This statistical approach provides a more stable and accurate picture for reliably planning the capacity of future sprints.
Cumulative flow diagrams
CFDs show work distribution across your entire workflow. Each colored band represents a workflow stage, with width showing how much work is there.
Healthy CFDs have parallel bands of consistent width. Bulging bands indicate bottlenecks that need attention.
Control charts
These charts add statistical control limits to your metrics. They help distinguish real changes from normal variation.
When a metric moves outside control limits, investigate. Inside the limits? That’s just normal variation — don’t overreact.
Building real-time dashboards
Real-time dashboards keep metrics visible without manual updates, forming a solid Agile strategy for cross-functional teams. Design different views for different audiences — developers need different data than executives.
Key dashboard principles:
- Focus on actionable metrics: if it doesn’t drive decisions, leave it out.
- Update automatically: manual updates create delays and errors.
- Make it visual: charts communicate faster than numbers.
- Keep it simple: too much information overwhelms.
Choosing the right Agile metrics for your team
Start small with metrics that address your biggest pain points. As you mature, add metrics that provide new insights.
Different methodologies and team types benefit from different metrics. Choose ones that support your specific way of working.
Sprint metrics for Scrum teams
Scrum teams need metrics that align with sprint ceremonies. These measurements support planning, daily stand-ups, reviews, and retrospectives.
Essential Scrum metrics include velocity for planning, burndown for daily tracking, and sprint goal success rate for retrospectives. Platforms like monday dev provide Scrum-specific views that make these metrics effortless to track.
Flow metrics for Kanban teams
Kanban teams focus on continuous flow rather than sprints. Their metrics emphasize throughput, cycle time, and WIP limits.
These teams benefit from cumulative flow diagrams and control charts. The goal is optimizing flow rather than maximizing velocity.
Agile metrics for enterprise scale
Large organizations need metrics that work across multiple teams. These include portfolio-level views and dependency tracking.
Enterprise metrics balance team autonomy with organizational alignment, supporting a broader Agile transformation across departments. Teams maintain their own metrics while contributing to higher-level views.
Avoiding metric overload
More metrics don’t mean better insights. Too many measurements create confusion and analysis paralysis.
Start with three to five core metrics. Add new ones only when they answer specific questions you can’t address with existing data.
Common Agile metrics pitfalls and how to avoid them
Even well-meaning teams can misuse metrics in ways that hurt rather than help. Understanding these pitfalls helps you avoid them.
Gaming the system
When metrics become targets, teams find ways to manipulate them. They might inflate estimates, avoid hard work, or sacrifice quality for velocity.
Prevent gaming by:
- Using multiple metrics: no single metric tells the whole story.
- Focusing on trends: patterns matter more than absolute numbers.
- Celebrating learning: make improvement more important than hitting targets.
- Rotating focus: don’t obsess over the same metrics forever.
Focusing on activity over outcomes
Being busy doesn’t mean being productive. Tracking activities like hours worked or tasks completed misses the point of Agile development.
Shift your focus to outcomes. Instead of counting completed work items, measure customer value delivered and business impact achieved.
Creating metric silos
Optimizing one metric often hurts others. Pushing for higher velocity might increase defects. Focusing on individual performance might harm collaboration.
Use balanced scorecards that consider multiple dimensions of performance. Optimize for the whole system, as quality, speed, and team health are equally critical factors .
Agile metrics in the age of AI
AI transforms how Agile metrics are collected and interpreted. It spots patterns humans miss and predicts problems before they occur. For example, a 2022 study published in Applied Sciences found that one AI-enhanced framework achieved 94% accuracy in risk identification, leading to an 18% improvement in sprint completion rates.
Modern solutions, like monday dev, leverage AI to provide intelligent insights without extra effort. These systems learn from your team’s historical data and performance trends to offer increasingly valuable recommendations and anomaly alerts.
Transform your Agile metrics with monday dev
Tracking metrics shouldn’t feel like extra work. With monday dev, your data becomes part of how your team naturally operates — automatically captured, organized, and presented in ways that drive real decisions.
Built on the monday Work OS, monday dev combines powerful metric tracking with the flexibility Agile teams need. It adapts to your workflow instead of forcing you to fit someone else’s process.
From automated sprint reporting to real-time dashboards and portfolio-wide visibility, every feature is designed to make metrics meaningful — so your team can focus on delivering value, not maintaining spreadsheets.
Automated sprint tracking and reporting
Eliminate manual overhead by having key sprint data captured and reported automatically as your team works.
- Real-Time data sync: sprint boards sync seamlessly with your backlog, tracking story points, task completion, and team capacity in real-time.
- Instant visibility: built-in burndown charts update automatically as work progresses, giving you instant visibility into sprint health without manual calculations.
- Scheduled stakeholder reports: schedule automated reports to deliver sprint summaries, velocity trends, and quality metrics directly to stakeholders’ inboxes, freeing the team from report generation.
Customizable Agile dashboards
Build highly focused metric views tailored exactly to your audience and purpose.
- Audience-specific views: create focused views for daily stand-ups, detailed analytics for retrospectives, and high-level summaries for stakeholder updates. Each dashboard updates in real-time.
- Extensive widget library: choose from 30+ widget types including velocity charts, cumulative flow diagrams, cycle time distributions, and custom formulas that calculate exactly what your team needs to see.
- No-code customization: drag-and-drop dashboard builders let you arrange metrics visually without technical expertise, ensuring developers and executives can access the metrics most relevant to them.
Seamless cross-team visibility
As organizations scale, coordinating multiple teams becomes critical. Platforms like monday dev provide essential portfolio views while preserving team autonomy.
Teams see how their work connects to others without drowning in irrelevant details. Dependency tracking highlights blockers between teams before they cause delays, and portfolio-level roadmaps aggregate progress across multiple sprints and teams, showing how individual contributions roll up to organizational goals.
This balance enables teams to incorporate Agile best practices effectively. Cross-board automations keep related work synchronized, while customizable permissions ensure teams maintain control over their own processes.
Real-time performance insights
Waiting for end-of-sprint reports means missing opportunities to improve. Real-time metrics let you spot and fix problems immediately.
Advanced platforms like monday dev surface insights as they emerge. You might discover a bottleneck forming or see that you’re ahead of schedule: both valuable for making quick adjustments. AI-powered notifications alert you to anomalies like unusual cycle time spikes, declining velocity trends, or quality issues before they impact delivery.
Integration with Git, Jira, and other development tools means code commits, pull requests, and deployments automatically update your metrics. This creates a complete picture of your development pipeline from planning through production.
Start tracking what matters most
Begin by selecting metrics that directly address your most pressing challenges. If you are struggling with predictability, start by tracking velocity and cycle time. If you face quality issues, focus immediately on defect metrics and test coverage.
Platforms like monday dev make this process easy with pre-built templates for common Agile workflows. You can choose a Scrum template with velocity tracking and sprint burndowns already configured, or start with a Kanban template featuring cycle time and throughput metrics. Customize these templates from there as your team’s needs evolve.
Remember that metrics serve your team, not the other way around. They should make your work easier and more successful, not create additional reporting burden. Offered by modern platforms like monday dev’s no-code approach means anyone on your team, from the scrum master to a developer, can instantly adjust dashboards, create new views, or modify tracking without waiting for IT support.
Ready to see how the right platform can transform your Agile metrics? Try monday dev and discover how automated tracking, intelligent insights, and seamless integrations can help your team deliver more value with less effort.
Frequently asked questions
How many Agile metrics should a team track initially?
It’s best to start with a small, focused set of metrics — usually three to five. Begin with core measures like velocity to understand team capacity, cycle time to track efficiency, and a quality metric such as escaped defects to ensure you’re not trading quality for speed. Once your team feels confident using these consistently, you can gradually add metrics that align with your specific goals, like predictability or customer satisfaction.
What is the difference between Agile velocity and throughput?
Velocity measures story points completed per sprint, focusing on estimated effort to help with sprint planning. Throughput counts actual items completed regardless of size, showing your true delivery rate and helping identify flow patterns.
How often should Agile teams review their metrics?
Review different metrics at different frequencies based on their purpose. Check daily metrics like burndown during stand-ups, analyze sprint metrics during retrospectives, and examine trends monthly or quarterly for strategic planning.
Which Agile metrics work best for distributed teams?
Distributed teams benefit most from flow-based metrics like cycle time, throughput, and cumulative flow diagrams. These metrics focus on work progression rather than physical presence, making them ideal for remote collaboration.
How do you prevent team members from gaming Agile metrics?
Prevent gaming by emphasizing trends over absolute numbers and using multiple complementary metrics. Focus discussions on learning and improvement rather than hitting targets, and regularly rotate which metrics receive primary attention.
Can Agile metrics be applied to non-software development teams?
Agile metrics work well for marketing, HR, operations, and other teams by adapting the concepts to fit their work. Define what constitutes a "work item" and "done" for each team type, then apply flow and value metrics accordingly.