

Development teams often face a fundamental conflict. Leadership and business stakeholders need clear, predictable timelines to plan launches and manage expectations. At the same time, engineering teams need the flexibility to adapt, iterate, and respond to change without being locked into a rigid plan. This tension between visibility and agility is where many projects lose momentum.
The Agile Gantt chart offers a practical solution, blending the visual clarity stakeholders need with the flexibility development teams require. It provides a shared language for everyone involved in shipping a product, transforming how organizations balance planning with adaptability. When implemented correctly, these charts are more than just a schedule. They become a dynamic platform for collaboration that removes blockers and connects engineering with the rest of the business.
The following sections explore how Agile Gantt charts help teams align, manage dependencies, and communicate progress across complex development environments. They cover key components, best practices for maintaining flexibility, scenarios where they add the most value, and how modern platforms enhance planning, automation, and cross-team collaboration.
Key takeaways
- Bridge visibility and flexibility seamlessly: Agile Gantt charts show sprints as movable blocks, giving timeline clarity while keeping teams adaptable to changes.
- Deploy strategically for maximum impact: use Gantt charts for multi-team coordination, external dependencies, or stakeholder reporting, but skip them for small single-team projects where a Kanban board suffices.
- Maintain agility through smart planning: plan current sprints in detail, keep future work as epic placeholders, and update at natural points like sprint reviews to stay flexible.
- Automate progress tracking with advanced platform: solutions like monday dev sync Gantt charts with GitHub, GitLab, and Jira, updating progress automatically and letting teams focus on building instead of reporting.
- Visualize dependencies for informed decisions: track dependencies and resource conflicts with color-coded critical paths, so stakeholders immediately see trade-offs and ripple effects across your timeline.
What are Agile Gantt charts?
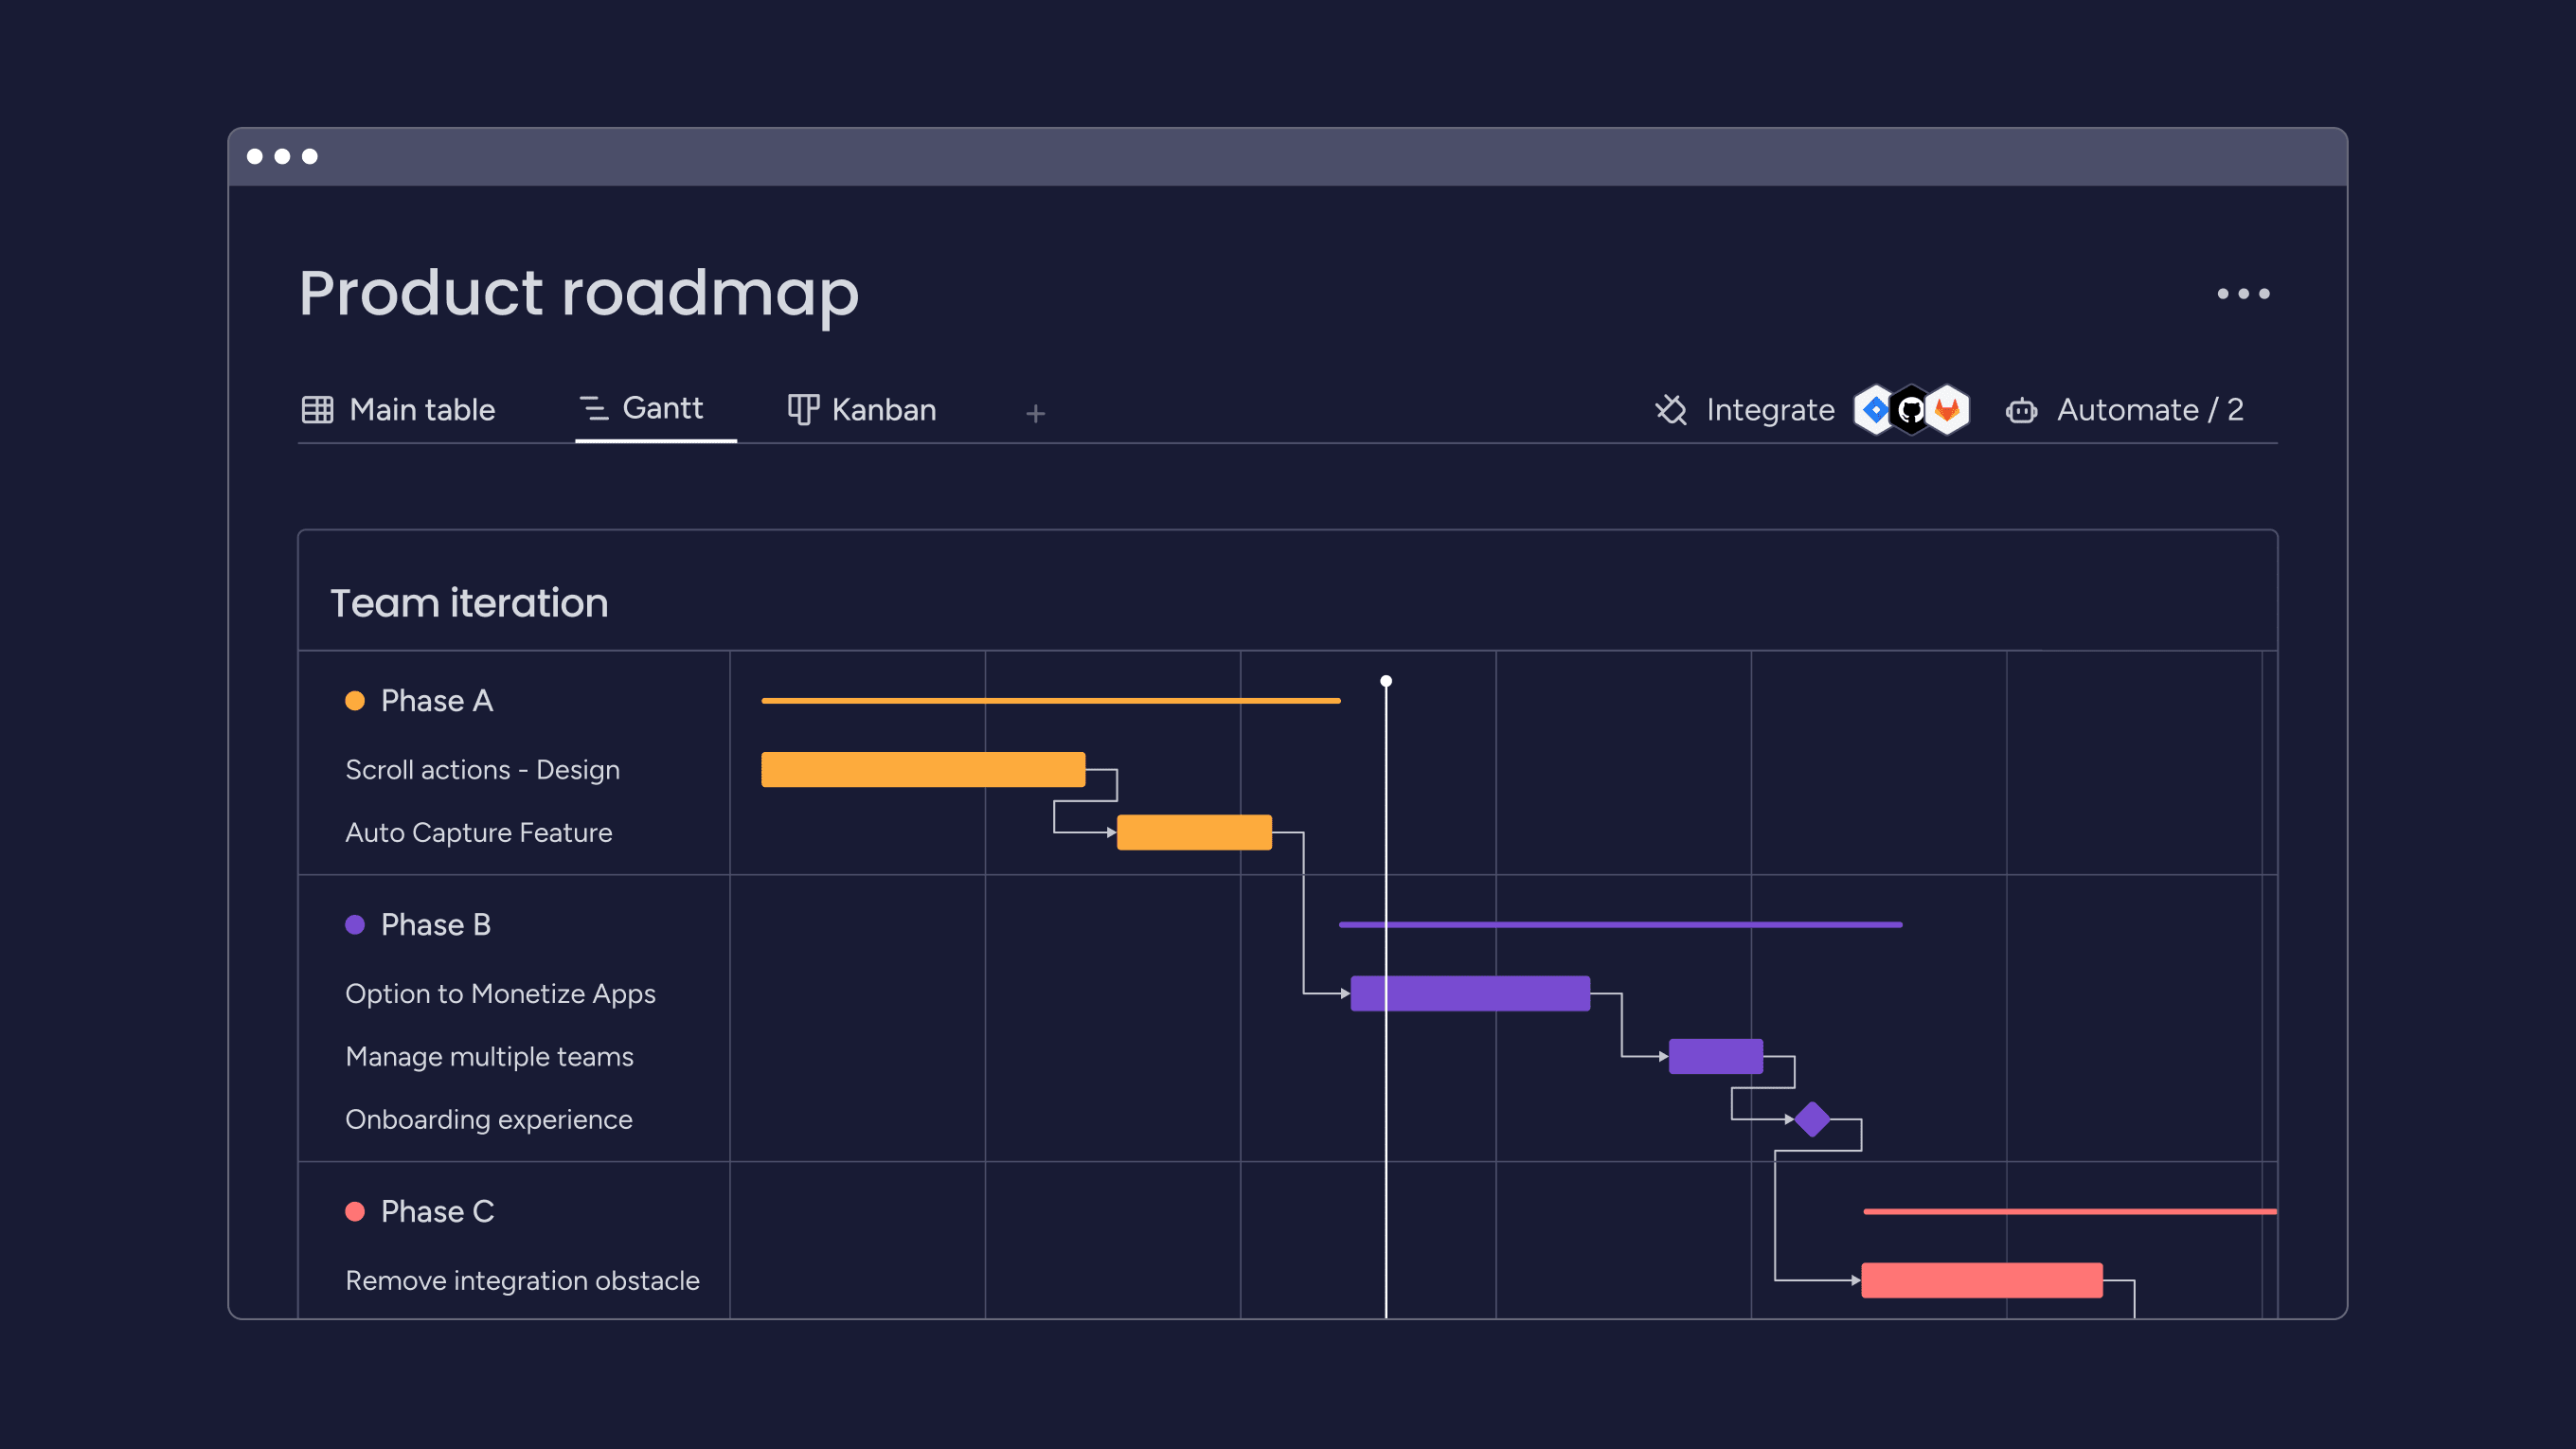
An Agile Gantt chart is a visual timeline that combines traditional project scheduling with the flexibility of Agile project management methodologies. It shows your sprints as blocks on a timeline, making it easy to see when work will happen while still allowing for the changes that come with agile development.
This approach serves as a bridge between two worlds, delivering the visual clarity that stakeholders value in Gantt charts while maintaining the adaptability development teams require to respond to changing requirements.
How Agile Gantt charts differ from traditional Gantt charts?
Traditional Gantt charts lock you into a fixed plan from day one. Agile Gantt charts treat plans as living documents that evolve with each sprint.
The differences show up in how you use them:
- Planning approach: traditional charts map every task months in advance, while agile versions focus on the next few sprints.
- Change handling: Waterfall charts require formal change requests, but agile charts absorb changes naturally through sprint planning.
- Team involvement: one person creates traditional charts, but the whole team updates Agile versions.
- Update frequency: traditional charts change rarely, while agile charts refresh after every sprint or even daily.
Key components of Agile Gantt charts
Understanding the building blocks helps you create charts that actually support your workflow. Each component serves a specific purpose in making agile work visible and manageable.
Sprint blocks are the foundation. Each sprint appears as a container on the timeline, holding the work your team commits to delivering. When priorities shift, you can move entire blocks or adjust their contents without rebuilding everything, showcasing the flexibility of Agile planning.
User stories and epics live inside sprint blocks. This hierarchy shows stakeholders which features you’re building when, without drowning them in technical details. Dependencies between sprints appear as connecting lines, making it obvious when one team’s delay will impact another.
Why do development teams use Gantt charts for Agile projects?
Development teams face a constant challenge: how do you maintain Agile flexibility while giving stakeholders the visibility they need? Agile Gantt charts solve this by creating a shared visual language that works for everyone.
Visual clarity for cross-functional alignment
Your development work involves many roles: engineers, designers, product managers, and QA specialists. Each person needs to understand how their work fits into the bigger picture.
For example, according to a 2023 McKinsey report, CEOs in high-performing organizations establish dedicated cross-functional foresight teams to continually scan the environment and integrate insights into planning processes, demonstrating the critical importance of coordinated team alignment.
An Agile Gantt chart creates this shared understanding. Engineers see when their API needs to be ready. Product managers can tell sales exactly when features will be available. Everyone works from the same visual timeline, but interprets it through their own lens.
Managing dependencies across distributed teams
Modern development rarely happens in isolation. Your payment team builds an integration while another team creates the checkout flow that depends on it.
Agile Gantt charts make these connections explicit. When the payment team needs an extra sprint, everyone immediately sees which downstream work gets affected. This visibility turns potential surprises into manageable adjustments.
Communicating with stakeholders who need dates
“When will this be done?” remains the most common stakeholder question. Agile Gantt charts provide date-based visibility while maintaining flexibility.
The chart shows current projections based on sprint commitments. When scope changes or velocity shifts, you update the timeline. Stakeholders appreciate this transparency — they’d rather get honest updates than false certainty.
When to use Agile Gantt charts in your workflow?
Agile Gantt charts aren’t a universal requirement; they’re a strategic tool that adds value in specific situations. The key is recognizing when they’ll streamline coordination versus when they’ll just create unnecessary overhead that slows your team down.
Ideal scenarios for Agile Gantt charts
Multi-team coordination tops the list. When several teams work toward a common release, the visual timeline helps everyone see how their sprints align. You spot conflicts before they cause delays.
External dependencies also justify Gantt charts. If your work depends on vendors, hardware deliveries, or regulatory approvals, plotting these constraints helps you plan around them.
Consider these situations where Agile Gantt charts provide clear value:
- Stakeholder-heavy projects: executives and clients understand timelines more easily than sprint velocities.
- Complex feature rollouts: development, QA, DevOps, and marketing all need to coordinate their efforts.
- Portfolio management: multiple related projects require resource balancing and milestone alignment.
When simpler approaches work fine?
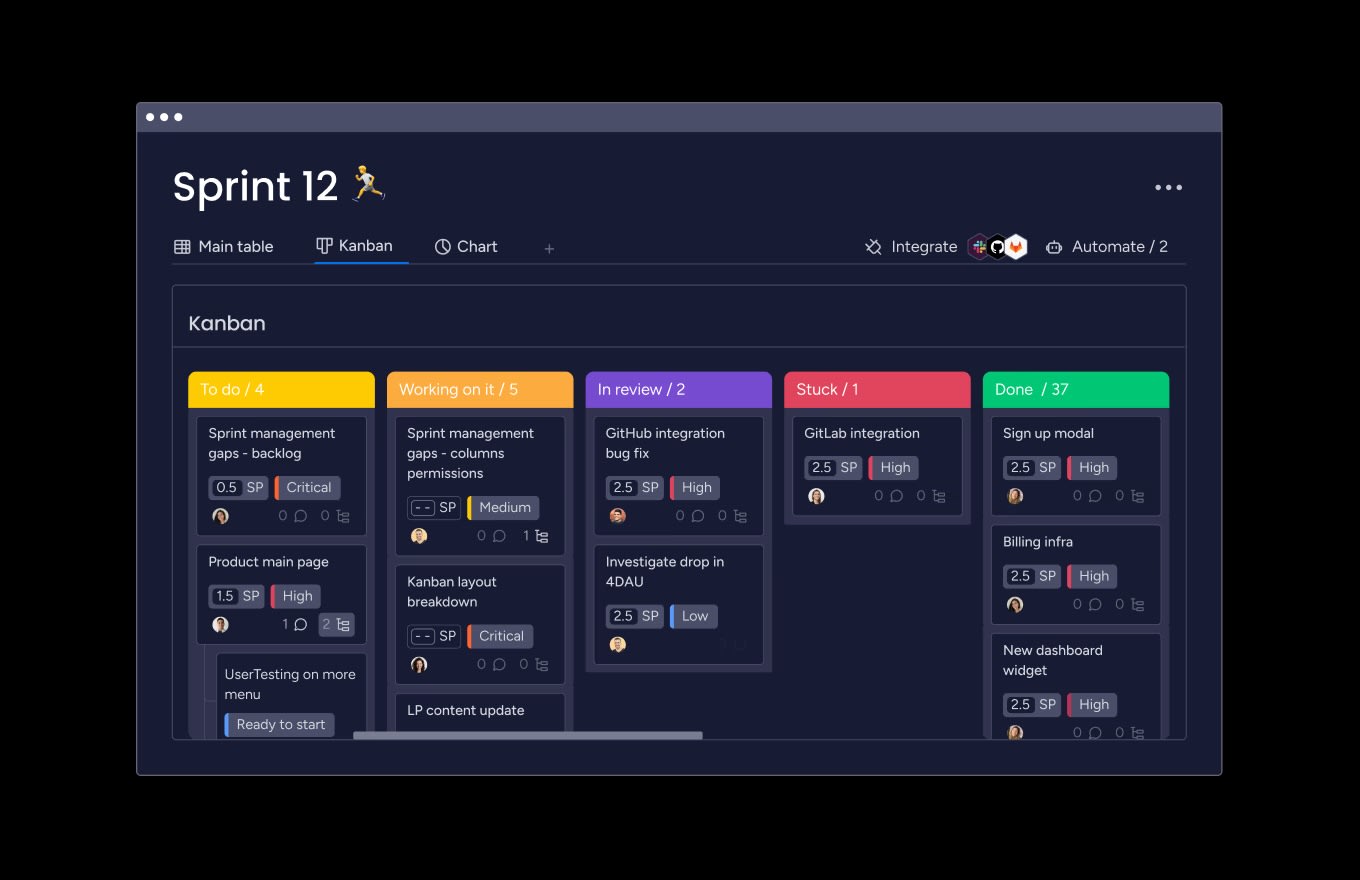
Small, single-team projects often run fine with just a Kanban board, yet comparing Gantt vs Kanban helps identify the best approach for each scenario. If you’re working independently with minimal dependencies, the overhead of maintaining a Gantt chart might slow you down.
Highly experimental work like prototyping benefits from maximum flexibility. When you’re exploring rather than executing, loose roadmaps are more effective than detailed timelines.
Essential features for Agile Gantt chart platforms
Not all Gantt chart platforms are built for agile workflows. The right tool needs to balance structure with flexibility, giving you timeline visibility without locking you into rigid plans. Here are the essential capabilities that separate platforms designed for Agile teams from traditional project management tools.
Sprint-based planning and visualization
Your platform should organize work around sprints, not arbitrary dates. Look for drag-and-drop interfaces that let you quickly move work between iterations. Adjusting plans should feel as natural as moving sticky notes on a board.
Modern platforms like monday dev excel here by treating sprints as flexible containers. You define your cadence, assign work to iterations, and visualize how sprints connect, all without fighting against rigid project structures.
Real-time collaboration capabilities
Development happens across locations and time zones. Your Gantt chart needs to support simultaneous updates without conflicts. Changes should appear instantly for everyone viewing the chart.
Built-in commenting keeps discussions in context. Instead of switching to email to ask about a dependency, team members comment directly on the relevant sprint block.
Integration with development workflows
Your Gantt chart should connect seamlessly with platforms where work actually happens. When a developer marks a story complete in Jira or merges code in GitHub, the chart should update automatically.
This integration eliminates duplicate data entry and ensures your timeline reflects reality, not wishful thinking.

"monday dev empowered us to optimize our GTM approach, resulting in faster, more dependable deliveries"
Steven Hamrell | Director of Product Management
"monday dev empowers us to manage the entire development process on one platform so we can speed up product delivery and improve customer satisfaction"
Mitchel Hudson | Head of Technology
"We're operating in an open, deep trusting, transparent environment with no silos of information. It's about completely opening access to everyone who needs it."
Alan Schmoll | Executive Vice President, Vistra PlatformHow to create an Agile Gantt chart in 5 steps?
Building an Agile Gantt chart doesn’t have to be complicated. The key is starting with a solid foundation and layering in the right details at each stage. Follow these five steps to create a chart that balances visibility with the flexibility your team needs to adapt and deliver.
Step 1: define your sprint structure and key milestones
Start with your sprint cadence. Whether you run one-week or two-week sprints, this rhythm becomes your chart’s foundation. Keep it consistent as changing sprint lengths mid-project complicates everything.
Identifying major milestones that span multiple sprints helps teams see how individual sprints build toward larger goals.
Step 2: map user stories and epics to sprints
Break your backlog into sprint-sized chunks. Each story should fit within one iteration, though Agile epics can span multiple sprints.
Use historical velocity to plan realistically. For example, if your team typically completes 30 story points per sprint, don’t plan for 50 and hope for the best.
Step 3: identify and visualize dependencies
Map connections between stories, both within and across sprints. Some dependencies are technical; login must work before password reset. Others are resource-based: the same developer can’t build two critical features simultaneously.
Hold a dependency review with all involved teams. Walking through the chart together surfaces hidden connections that individual teams might miss.
Step 4: assign resources and set realistic timelines
Allocate team members based on skills and availability. Remember that no one is 100% available for development: meetings, support, and other commitments eat into coding time.
Include buffers for the unexpected, such as bugs or production issues. Avoid overloading sprints to preserve flexibility.
Step 5: configure automation and establish update rhythms
Set up notifications for key events: sprint starts, approaching deadlines, blocked work. These alerts keep everyone informed without constant manual communication.
Establish when the chart gets updated. Many teams update during daily standups. Others prefer end-of-day updates. Consistency matters more than specific timing.
Managing dependencies and resources without creating bottlenecks
Dependencies and resource constraints are where many Agile projects stumble. The challenge isn’t just tracking who’s working on what, but making these connections visible so teams can coordinate effectively without constant meetings. When you can see how work flows between sprints and teams, you transform potential bottlenecks into manageable coordination points.
Visualizing cross-sprint dependencies
Dependencies that span multiple sprints require special attention, as they lengthen feedback loops and increase the risk of misalignment.
Use color coding to distinguish dependency types:
- Critical path: work that will definitely block progress if delayed.
- Preferred sequence: ideal order that could be adjusted if needed.
- Nice-to-have: connections that would be convenient but aren’t essential.
Balancing team capacity across projects
Most teams juggle multiple initiatives including features, technical debt, bug fixes, and operational improvements. Your Gantt chart should show how these compete for the same resources.
Establish capacity rules. You might dedicate 70% to features, 20% to technical debt, 10% to bugs. These allocations ensure important-but-not-urgent work doesn’t get perpetually deferred.
Adapting to changes without disrupting flow
Change is inevitable. How you handle it determines whether it disrupts flow or gets absorbed smoothly. With only one-third of surveyed directors confident in their organizations’ ability to manage policy changes, Agile planning tools that support rapid adaptation and cross-functional alignment become essential for maintaining project momentum.
When priorities shift mid-sprint, visualize the ripple effects. If adding a new feature means pushing other work out, show stakeholders this trade-off explicitly. Visual representation makes the cost of concrete change.
Gantt charts for Scrum, Kanban, and hybrid methodologies
Different Agile methodologies require different approaches to Gantt chart implementation. The key is adapting the visualization to match your team’s workflow rather than forcing your process to fit a rigid template. Whether you’re running Scrum sprints, managing Kanban flow, or navigating a hybrid environment, your Gantt chart should enhance coordination without compromising the principles that make your methodology effective.
Implementing Gantt charts in Scrum frameworks
Scrum teams use Gantt charts for release planning across sprints, not daily task tracking. The chart shows which stories are planned for each sprint and how they build toward releases.
During sprint planning, reference the chart for context. If a story sits on the critical path for an upcoming release, it might take priority. The chart provides strategic perspective without dictating tactical execution.
Update the chart during sprint reviews and retrospectives. This rhythm keeps it current without constant maintenance during active development.
Continuous flow visualization for Kanban teams
Kanban teams don’t work in fixed iterations, so their Gantt charts look different. Instead of sprint blocks, they show continuous flow with expected completion dates based on cycle time.
Work-in-progress limits from your Kanban board should reflect in the Gantt chart. If you limit development to five items, don’t show more than five in progress at any time.
Supporting hybrid Agile-Waterfall environments
Many organizations mix Agile and Waterfall approaches. Your Gantt chart can bridge these worlds by showing how Agile sprints align with waterfall milestones.
Map sprint boundaries to project phases. Multiple sprints might collectively deliver what waterfall teams call a phase. This translation helps everyone understand progress in familiar terms.
How to overcome common Gantt chart challenges?
Even well-designed Agile Gantt charts can run into obstacles that limit their effectiveness. The good news? Most challenges have straightforward solutions that preserve both visibility and flexibility. Here’s how to address the most common issues teams face when implementing Agile Gantt charts.
Challenge 1: chart becomes too complex to read
Large projects can produce charts so dense they’re impossible to interpret. The solution lies in creating multiple views at different detail levels.
Create focused views for different audiences:
- Executive view: major milestones and epic-level progress only.
- Team lead view: sprint-level detail for their area.
- Developer view: specific sprint contents and technical tasks.
Challenge 2: maintaining Agile flexibility
Sometimes teams create charts so detailed they become Waterfall plans in disguise. Therefore, avoid plotting every task for the next six months with specific dates.
Plan in waves with decreasing detail. The current sprint gets full detail. The next two to three sprints show story-level plans. Future work appears as epic placeholders only.
Challenge 3: keeping the chart current
Outdated charts lose credibility fast. When team members stop trusting the chart, they stop using it for coordination.
Automation is your primary solution. Integrate with development platforms so progress flows automatically. When developers mark work complete, the chart updates without manual intervention.
Challenge 4: aligning technical and non-technical stakeholders
Technical teams and business stakeholders speak different languages. Your chart needs to translate between them.
Create abstraction layers. Executives see “Payment Integration” as one item. Developers see the dozen stories that comprise it. Both views are correct for their audience.
Real-world examples of Agile Gantt charts in action
Theory only takes you so far. The real test of Agile Gantt charts comes when teams face complex coordination challenges in production environments. These examples show how organizations across different scales use Agile Gantt charts to solve specific problems: from aligning multiple development teams to coordinating cross-functional launches and managing entire product portfolios.
- Multi-team product release coordination: a software company coordinates five teams building a major release. Each team owns different components including platform, API, features, DevOps. Their Gantt chart shows aligned sprints with dependency lines connecting related work. When the API team needs an extra sprint, the impact on feature teams becomes immediately visible.
- Cross-functional feature rollout: a SaaS company launches an analytics feature requiring coordination across engineering, design, QA, DevOps, customer success, and marketing. The chart shows how engineering sprints align with design iterations, QA cycles, and marketing milestones. When QA finds issues requiring more engineering work, the team can see exactly which other activities get impacted.
- Portfolio-level program management: an enterprise manages multiple products sharing infrastructure and resources. Their portfolio Gantt chart aggregates sprint plans from all teams. The chart highlights resource conflicts when multiple teams need the same specialized engineer. It also shows when different products plan simultaneous releases that might overwhelm support teams.
AI and automation transforming Agile planning
The next evolution in Agile Gantt charts isn’t just about better visualization, but about intelligent systems that learn from your team’s patterns and proactively guide planning decisions. AI and automation are transforming how teams plan sprints, detect risks, and communicate progress, shifting from reactive updates to predictive insights that keep projects on track.
Intelligent sprint planning
AI analyzes historical data to suggest realistic sprint commitments. Instead of guessing capacity, the system recommends sprint contents based on past velocity and current team availability. Advanced analytics, including AI tools, are now used by CEOs to monitor data streams in real time and integrate these insights into performance targets and strategic planning.
Predictive models identify stories likely to take longer than estimated. If your team consistently underestimates certain work types, AI flags similar new items as risky.
Proactive risk detection
AI monitors charts for patterns that predict problems. If a sprint tracks behind in ways resembling past failures, you get early warning.
Dependency analysis identifies critical paths automatically. The system simulates what happens if specific work slips, showing cascading effects across the project.
Automated progress reporting
AI generates status summaries by analyzing chart data. Instead of manually creating reports, you get automated highlights of completed work, blockers, and upcoming risks.
Stakeholder notifications adapt to each person’s role. Executives get milestone updates. Team leads receive detailed sprint progress. The system learns what information matters to whom.
How monday dev empowers Agile teams with flexible Gantt charts?
The right platform makes all the difference between Gantt charts that enable agility and ones that constrain it. Built specifically for development teams who need timeline visibility without sacrificing the flexibility that makes Agile work, monday dev transforms Agile Gantt charts from static schedules into dynamic collaboration tools.
Design workflows that match your process
Every team works differently. Rather than forcing you into predetermined structures, monday dev adapts to your approach.
Configure sprint lengths, define custom workflow stages, create views that make sense for your team. Whether you follow Scrum, Kanban, or something unique, the platform supports your methodology.
Connect engineering, product, and leadership
By providing a shared workspace, monday dev breaks down silos. Engineers update technical progress. Product managers adjust priorities. Executives track milestones. Everyone works from the same data but sees their relevant perspective.
Integration with GitHub, GitLab, and Jira means technical work stays synchronized automatically. When developers merge code, the Gantt chart reflects progress without manual updates.
Gain visibility without sacrificing speed
Real-time Agile dashboards show sprint progress, resource allocation, and upcoming risks. Managers get the oversight they need while teams maintain autonomy.
Automation rules trigger based on your conditions. When sprints end, incomplete work moves automatically. When dependencies are complete, blocked teams get notified. Your chart stays current without constant manual maintenance.
The content in this article is provided for informational purposes only and, to the best of monday.com’s knowledge, the information provided in this article is accurate and up-to-date at the time of publication. That said, monday.com encourages readers to verify all information directly.
Frequently asked questions
Is a Gantt chart Agile or Waterfall?
A Gantt chart is a visualization tool that can support both Agile and Waterfall methodologies. Traditional Gantt charts were designed for Waterfall projects with fixed timelines and minimal changes. Agile Gantt charts adapt this concept by showing flexible sprint blocks instead of rigid task schedules, supporting iterative planning and frequent adjustments that align with Agile principles.
How do Gantt charts support scrum methodology?
Gantt charts support Scrum by visualizing sprint timelines, dependencies between teams, and progress toward release goals. Scrum teams use them primarily for release planning across multiple sprints rather than daily task tracking. The chart helps product owners communicate roadmaps to stakeholders while maintaining the flexibility to adjust priorities each sprint based on feedback and changing requirements.
What's the difference between a roadmap and Gantt diagram?
A roadmap presents high-level strategic goals and priorities over time without specific dates or dependencies. A Gantt diagram shows detailed timelines with specific start and end dates, dependencies between tasks, and resource allocations. Roadmaps communicate the "what" and "why" of your plans, while Gantt diagrams detail the "when" and "how" of execution.
How often should Agile teams update their Gantt charts?
Agile teams should update their Gantt charts at natural rhythm points in their process — typically at sprint boundaries when planning upcoming work or during sprint reviews. Daily updates might be necessary for complex projects with many dependencies. The key is establishing a consistent update schedule that keeps the chart current without creating administrative burden.
Can Gantt charts work with continuous deployment?
Gantt charts can work effectively with continuous deployment by visualizing release windows and deployment schedules rather than individual features. Teams can show deployment cycles, integration windows, and coordination points with other systems. The chart helps manage the timing of releases even when development work flows continuously rather than in fixed sprints.
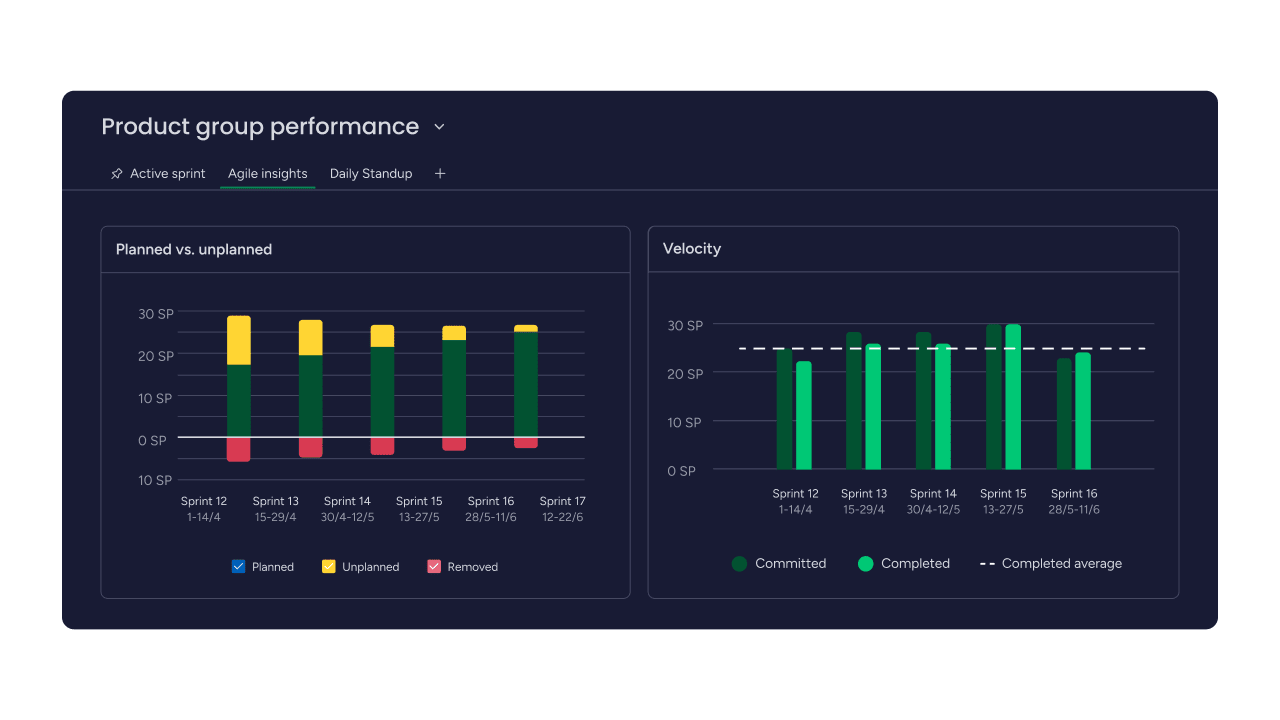
Which Agile metrics integrate with Gantt chart views?
Key Agile metrics that enhance Gantt chart views include velocity trends showing how much work teams complete per sprint, burndown rates indicating progress within sprints, and cycle time data revealing how long work items take from start to finish. These metrics help teams make realistic plans and identify when timelines need adjustment based on actual performance rather than estimates.