
A budget tracker that actually works. A project timeline that keeps everyone aligned. An inventory spreadsheet that finally makes sense of the supply chain. Then someone emails their “updated version,” another teammate creates their own copy, and suddenly there are five different files that all claim to be the source of truth.
Spreadsheet templates solve the blank-page problem, but they bring their own headaches: collaboration chaos, version control nightmares, and limits on how big organizations can grow. The right template turns scattered data into organized workflows and handles repetitive calculations automatically, giving teams a consistent way to get work done. Whether tracking budgets, managing projects, or organizing operations, a well-designed spreadsheet template becomes the foundation for reliable, repeatable processes.
You’ll discover the most effective spreadsheet templates for business workflows, what makes them actually work, and how to turn generic files into assets that drive real results. We’ll explore templates for project management, financial planning, HR, sales tracking, and operations, plus show how AI and connected platforms can turn static spreadsheets into workflows that scale as organizations grow.
Key takeaways
- Pre-built formulas save hours and reduce errors: effective templates use automated calculations, data validation rules, and conditional formatting to handle repetitive processes, freeing your team to focus on analysis instead of manual data entry.
- Adapt templates to match how your team actually works: customize column headers to reflect your company’s language, add business-specific fields, and remove irrelevant sections to boost adoption and cut confusion.
- Know when spreadsheets become bottlenecks: collaboration chaos, version control nightmares, and manual updates eating up valuable time signal it’s time to evolve beyond static files.
- Transform static spreadsheets into connected workflows: solutions like monday work management keep the familiar grid interface while adding real-time collaboration, automated notifications, and seamless integration with your existing business applications.
- Visual dashboards turn data into instant insights: conditional formatting, embedded charts, and dashboard-style summaries help stakeholders spot trends and make informed decisions without digging through rows of numbers.
The right template turns a blank spreadsheet into something your team will actually use. Templates cut mental overhead with built-in structure, catch errors with validation rules, and speed up decisions with automated calculations. Whether you’re managing projects, tracking budgets, or organizing inventory, a well-designed template gives you a consistent way to work that can grow with you.
This breakdown explores the high-impact templates across five critical operational areas, illustrating how structured data entry and automated reporting solve the unique challenges of modern project, financial, and people management.
Project management templates
Project management templates connect high-level strategy to daily execution. They give you direct visibility into timelines, resource allocation, and dependencies with no complex software setup required. These templates turn scattered project data into organized insights that keep teams aligned and deliverables on schedule.
| Template type | Primary function | Key features | Best for |
|---|---|---|---|
| Gantt chart tracker | Visualize project timelines | Conditional formatting, auto-populating bars, dependency tracking | Teams managing multi-phase projects |
| Resource allocation grid | Track team availability | Hour summation formulas, color-coded alerts, capacity planning | Managers balancing workloads |
| Agile sprint planner | Organize iterative work | Backlog management, velocity calculations, story point tracking | Teams using agile methodologies |
- Gantt chart trackers: use conditional formatting to create bar charts directly within cells. Project managers input start dates and durations, and the visual timeline populates automatically to identify overlaps and potential bottlenecks.
- Resource allocation grids: track team availability against project demands. Formulas sum hours across multiple projects, flagging overutilization with color-coded alerts to prevent burnout and ensure balanced workload distribution.
- Agile sprint planners: organize work into backlog, active sprint, and completed status. They calculate velocity based on story points and help teams maintain focus on immediate deliverables while keeping sight of the larger product roadmap.
Budget and financial planning templates
Financial templates need to be precise and locked down. They prioritize data integrity with locked cells and validation rules, keeping the numbers that drive decisions accurate and safe from accidental changes. These templates become the financial backbone for teams that need reliable, real-time budget tracking.
- Departmental budget trackers: break down annual allocations by quarter and category. They compare actual spend against projected budget in real-time, calculating variance percentages to alert managers before overspending occurs.
- Cash flow projection models: forecast liquidity by mapping expected receivables against payables over a 12-month period. Finance teams model different scenarios, such as delayed client payments or unexpected capital expenditures, to assess financial health. With 65% of CFOs planning to increase generative AI investment in 2025, these templates increasingly incorporate AI-assisted forecasting capabilities.
- Expense report generators: standardize reimbursement requests. They include dropdown menus for expense categories to ensure consistent coding for accounting and automatically sum totals while flagging entries that exceed policy limits.
HR and employee management templates
HR templates are all about standardization and compliance. They make sure every employee goes through the same processes, creating consistency and a reliable record for planning. These templates take the guesswork out of people management and build accountability from hire to retire.
- New hire onboarding checklists: outline every step of the integration process. From IT provisioning to the first manager meeting, these templates assign owners to each item and track completion status. This systematic approach ensures every onboarding step is completed during those critical first weeks, which is especially important given that 18% of new hires leave during probation.
- Employee performance matrices: aggregate review data, mapping employees across performance and potential axes. Leadership uses these visual representations to identify talent density and spot future leaders. The structured format makes succession planning and development conversations more objective and data-driven.
- Annual leave trackers: provide a centralized view of team availability. They calculate remaining time-off balances automatically and visualize team coverage on a calendar view, helping managers plan for adequate coverage during peak vacation periods.
Sales and CRM templates
Sales templates drive revenue generation. They organize customer data to ensure every lead is captured and give you the metrics you need for accurate forecasting. These templates turn scattered prospect info into a system for growing revenue.
- Sales pipeline dashboards: track deals through various stages of the funnel. They apply weighted probabilities to deal values based on their stage, generating realistic revenue forecasts that adjust automatically as deals progress or stall.
- Lead scoring calculators: objectively rank prospects based on demographic data and behavioral signals. They use points-based formulas to prioritize outreach, ensuring sales representatives focus their energy on the highest-value opportunities.
- Customer contact databases: serve as lightweight CRMs, organizing contact details, interaction history, and account status. Teams filter clients by industry, size, or last contact date to segment lists for targeted communication campaigns.
Inventory and operations templates
Operational templates give you clear visibility into resource management. They track physical and digital assets, making sure you have what you need when you need it. These templates prevent costly stockouts and help you run a more efficient supply chain with better data.
- Inventory management trackers: monitor stock levels, reorder points, and unit costs. Conditional formatting highlights items falling below minimum thresholds, triggering reorder processes before stockouts occur. Poor inventory control can be costly—aerospace and defense inventories alone have ballooned by more than $70 billion since 2016 due to inadequate tracking systems. These templates connect purchasing decisions to actual consumption patterns.
- Vendor management scorecards: track supplier performance across metrics like delivery speed, quality, and cost. Procurement teams use these objective evaluations to negotiate contracts and identify which vendor relationships need improvement or replacement.
- Operational KPI dashboards: aggregate critical metrics from various departments into a single view. They visualize trends in output, error rates, and efficiency metrics, giving leadership the insights needed to make informed operational decisions.

A template is only as good as how easy it is to use. The difference between a file that speeds up work and one that slows you down comes down to four key elements that work together. Understanding these elements helps teams pick or build templates that boost productivity instead of adding more work.
Pre-built formulas that save hours
Automation is what makes digital spreadsheets more powerful than paper ledgers. Effective templates use formulas to handle repetitive calculations, cutting down on errors and freeing up time for analysis.
- Automated status updates: formulas like IF and VLOOKUP automatically change statuses or flag overdue items based on date comparisons. No more manual row-by-row reviews.
- Instant data aggregation: functions like SUMIFS and COUNTIFS pull data into summary tables instantly. Add a new sales entry, and the quarterly revenue total updates right away.
- Built-in guardrails: formulas also protect your data. A budget template automatically subtracts expenses and flags you if the balance goes negative, stopping bad data before it gets in.
Smart data organization
How you structure a template determines how well it works. Well-organized templates keep raw data entry separate from analysis and reporting, so the file stays stable as your data grows.
- Separated data layers: high-quality templates designate specific tabs for data entry and separate tabs for dashboards or reports. This keeps users from accidentally breaking formulas when they add new data.
- Logical naming conventions: standardized column headers and named ranges make formulas way easier to read and fix. Referring to a range as “Q1_Revenue” is far more durable and understandable than referring to “Sheet1!C2:C50.”
- Workflow-driven layout: the layout mirrors your workflow — columns go left to right in the order you receive or process data.
Customization without complexity
The best templates hold their structure but flex to fit your specific needs. They recognize that no two organizations work exactly the same way.
- Central variable management: effective templates use helper tables for variables like tax rates, department names, or project statuses. Change a variable in one spot, and it updates dropdowns and formulas across the whole workbook.
- Scalable formulas: formulas utilize dynamic array functions or structured table references rather than fixed cell ranges. This keeps the template working whether you have ten rows or ten thousand.
- Built-in guidance: a dedicated “Start Here” tab or embedded notes explain how to modify the template safely.
Visual dashboards for instant insights
Data only matters if you can understand it fast. Effective templates use visual design to turn rows of numbers into insights you can act on.
- Conditional formatting: conditional formatting creates heat maps or progress bars right in the cells. Managers can scan a project list and instantly spot overdue items (red) or completed milestones (green) with no date-reading required.
- Embedded trend analysis: sparklines show trends over time alongside the raw data. This adds context — you can see if a number’s rising or falling without opening a separate chart.
- Dashboard-style summaries: the top of the sheet works like a dashboard, showing key metrics in large, bold numbers.
5 ways to transform generic templates into business assets
Downloading a template is just the start. To turn a generic file into something valuable, teams need to customize it to match how they actually work. These five steps make sure templates become part of your daily workflow instead of forgotten files.
1. Adapt data fields to match your workflow
Generic templates come with generic labels. Match the template’s language to how your team actually talks, and you’ll cut confusion and boost adoption.
- Customize column headers: rename columns to match the specific stages of the company’s workflow. Changing “Status” to “Production Phase” ensures that team members intuitively understand what information is required in each cell.
- Add business-specific fields: add columns for data points unique to the business model, such as SKU numbers, client tier levels, or specific regulatory compliance codes.
- Remove irrelevant elements: delete or hide columns that are irrelevant to the current process.
2. Build custom calculations for your metrics
Every business measures success differently. Adding custom formulas allows the template to calculate the specific KPIs that drive decision-making for the team.
- Calculate true profitability: instead of just tracking revenue, add formulas that subtract specific overhead costs to calculate gross margin per project or per unit.
- Monitor resource utilization: for service-based teams, create formulas that compare billable hours against total available hours to monitor efficiency and capacity.
- Apply strategic weightings: implement formulas that apply custom weightings to different variables to align the data with strategic priorities.
3. Add automated data validation
Data validation is the first line of defense against bad data. Restricting inputs ensures consistency, which is crucial for accurate reporting and filtering later on.
- Standardize categories: replace free-text fields with dropdown menus for categories like “Department,” “Status,” or “Priority.” This prevents variations that break pivot tables and sorting functions.
- Enforce data formats: restrict date columns to accept only valid date formats and use conditional formatting or data validation rules to flag or reject duplicate entries.
4. Create visual reports from raw data
Raw data rows are difficult to digest during a meeting. Building a reporting layer on top of the data transforms the spreadsheet into a communication asset.
- Build dynamic summaries: use pivot tables to summarize large datasets instantly, allowing users to slice data by quarter, region, or product line without altering the original records.
- Link visuals to data: link charts to these pivot tables so that the visuals update automatically as new data is added.
- Enable interactive filtering: add slicer buttons to charts and tables, allowing stakeholders to filter the visual reports interactively without needing to understand complex filtering menus.
5. Design reusable template libraries
Once a template is optimized, it should become the standard. Creating a library ensures that the entire organization benefits from the improvements and operates from a single source of truth.
- Protect the master: save the master template as a read-only file or a specific template file type.
- Organize for accessibility: store templates in a shared, accessible location organized by department or function.
- Document changes: maintain a hidden tab within the template that documents version history, noting what formulas were updated or what columns were added.
How does AI make spreadsheet templates smarter?
Artificial intelligence shifts spreadsheets from passive data storage to active assistants. Organizations leverage AI to handle the heavy lifting of data processing, analysis, and content generation. These capabilities transform how teams interact with data, making sophisticated analysis accessible to non-technical users.
Automated data categorization at scale
AI analyzes the context of cell content to organize unstructured data automatically. Instead of manually tagging thousands of rows, AI models identify patterns and apply categories. An AI integration can scan a list of credit card transaction descriptions and automatically classify them into “Travel,” “Software,” or “Meals” with high accuracy.
Teams using platforms like monday work management leverage AI Blocks to categorize data at scale, organizing it by type, urgency, or sentiment without manual intervention. This capability transforms how organizations handle large volumes of incoming data, from customer feedback to expense reports.
Extract information from any document
AI-powered optical character recognition and natural language processing allow spreadsheets to ingest data from non-tabular sources. Users upload PDFs of invoices, photos of receipts, or screenshots of tables, and the AI parses the visual information into structured rows and columns.
This eliminates the need for manual data entry, significantly reducing transcription errors and processing time for workflows like expense reporting or inventory intake. Organizations streamline document-heavy processes by automatically extracting key information and populating templates instantly.
Generate complex formulas with natural language
The barrier to entry for advanced spreadsheet functions has lowered significantly. Users no longer need to memorize complex syntax for nested functions. They type a request in plain English, and the AI generates the precise formula required.
This democratizes data analysis, allowing non-technical team members to extract deep insights without relying on data analysts. Teams accomplish more sophisticated analysis and reporting without specialized training.
Predictive insights from historical data
AI algorithms analyze historical data within the spreadsheet to forecast future trends. By identifying seasonality and growth patterns, these capabilities project future inventory needs, cash flow gaps, or project completion dates.
Unlike simple linear projections, AI models account for multiple variables and outliers, providing a probability range that helps leaders make more informed, proactive risk management decisions.
When do teams outgrow spreadsheet templates?
While spreadsheets offer flexibility, they aren’t infinite. As organizations scale, the very traits that make spreadsheets appealing become liabilities. Recognizing these signs of this ceiling helps teams transition before operational failure occurs. Understanding these limitations prevents teams from forcing spreadsheets beyond their natural capabilities.
Collaboration bottlenecks with multiple users
Spreadsheets were originally designed for individual analysis, not simultaneous team execution. When multiple users attempt to edit a complex template at once, performance degrades. Teams encounter “file locked” notifications, or worse, overwrite each other’s work.
The lack of granular permissions means that granting access to the file grants access to everything. This makes it difficult to involve stakeholders without risking data integrity or exposing sensitive information.
Version control becomes unmanageable
The “Final_v2_UPDATED” filename syndrome signals a broken process. As team members email, download, and save local copies, multiple versions of the “truth” proliferate across the organization. Leaders struggle to know which file contains the most current data.
Consolidating these disparate versions for a monthly report becomes a manual, error-prone nightmare of copy-pasting that wastes valuable time.
Data silos across departments
Spreadsheets live in folders, isolated from other business systems. A marketing budget tracker rarely integrates with a sales CRM or a product roadmap. This fragmentation creates data silos where decision-makers lack a holistic view of the organization.
To answer cross-functional questions, teams must manually cross-reference disconnected files, which slows decision-making and increases the risk of strategic misalignment.
Manual updates drain productivity
A static template requires constant human intervention to remain relevant. Every status change, date shift, or notification must be executed manually. As the volume of work increases, the administrative burden of maintenance begins to outweigh the actual value of the data.
Highly skilled employees often spend hours reconciling systems and updating cell formatting, rather than focusing on high-value strategic work that drives growth.
The transition from spreadsheets to a Work OS represents a shift from managing files to managing workflows. With monday work management, teams retain the familiar grid-like interface they love but gain the database capabilities, automation, and connectivity required for enterprise scale. This evolution preserves what works about spreadsheets while eliminating the friction that slows teams down.
| Challenge | Traditional spreadsheets | monday work management |
|---|---|---|
| Collaboration | File locking, overwritten data, limited permissions | Real-time co-authoring, item-level updates, granular permissions |
| Visibility | Disconnected files, manual reporting | Dashboards aggregating data across multiple boards instantly |
| Automation | Limited to in-cell formulas | Workflow automations that trigger actions and notifications |
| Integration | Manual data entry or complex CSV imports | Native, bi-directional sync with 200+ enterprise applications |
| Scalability | Performance lags with large datasets | Built to handle enterprise-grade data volume and complexity |
From static files to living workflows
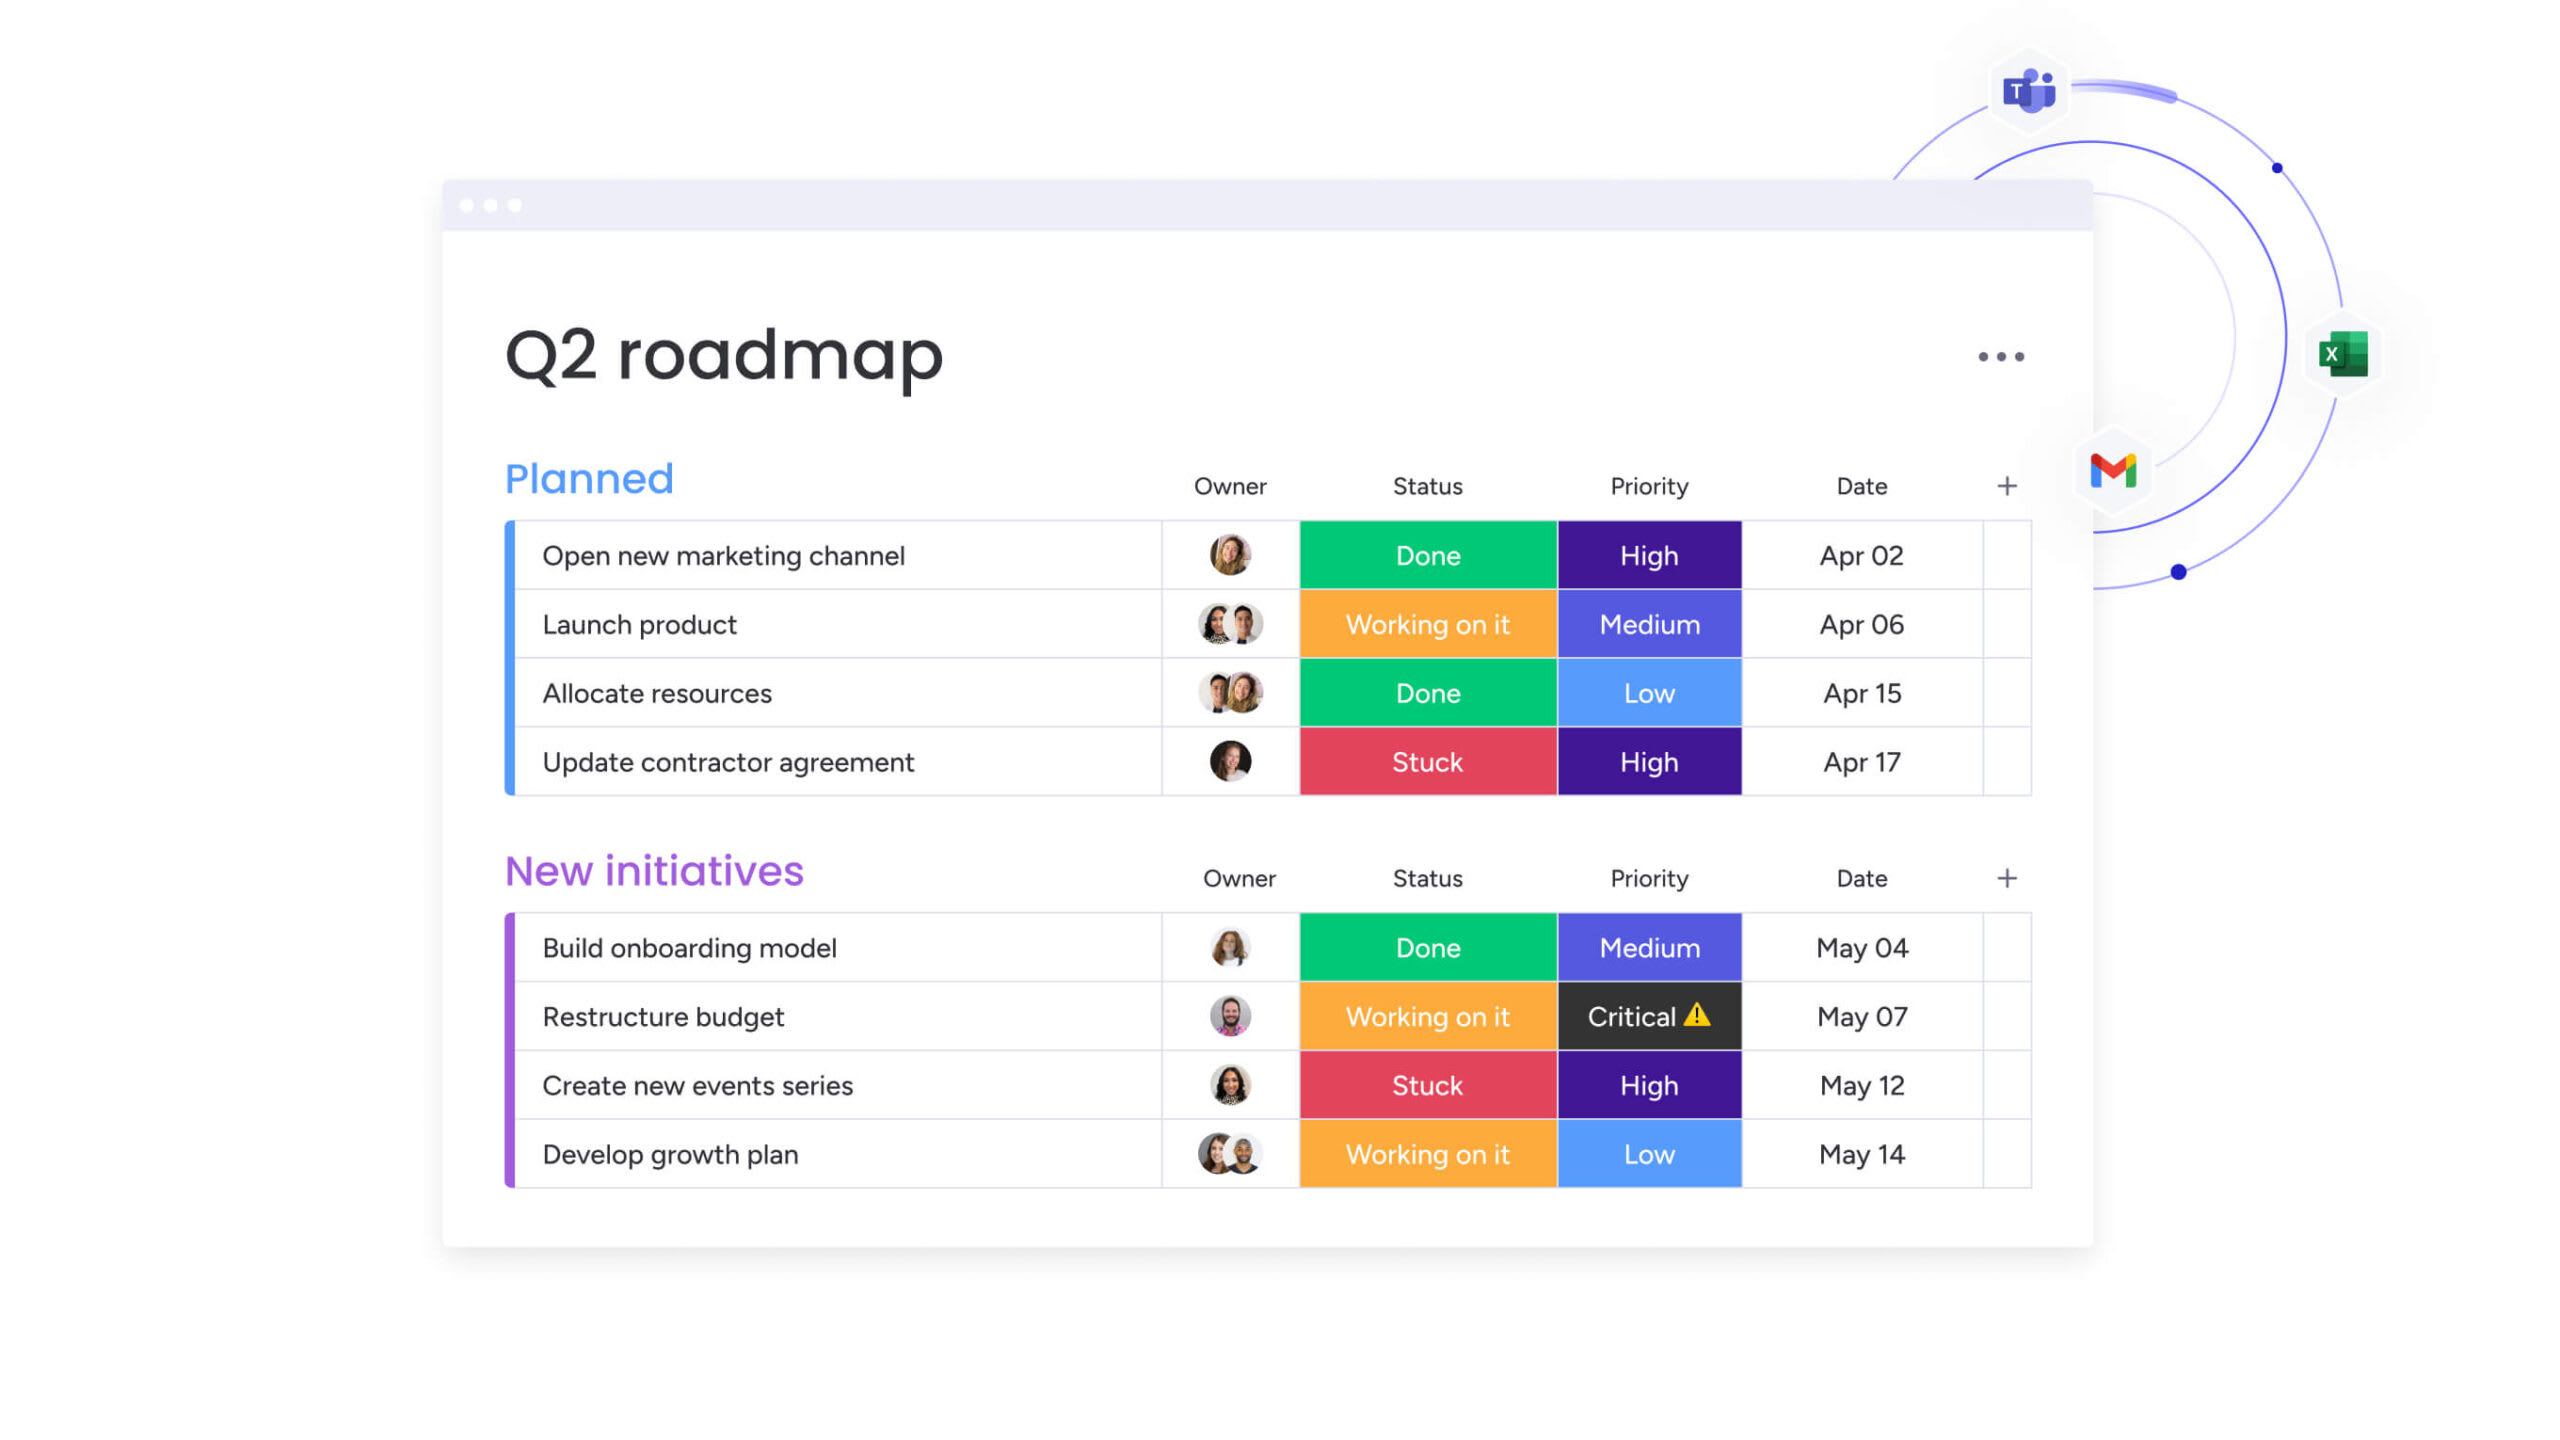
With monday work management, the concept of a “row” transforms into a dynamic item. A project line item becomes a digital container that holds communication, file attachments, and a complete audit log of changes. When a date changes in the timeline view, it updates everywhere instantly. This creates a living workflow where the data reflects the current state of reality without manual synchronization.
Automate work beyond basic calculations
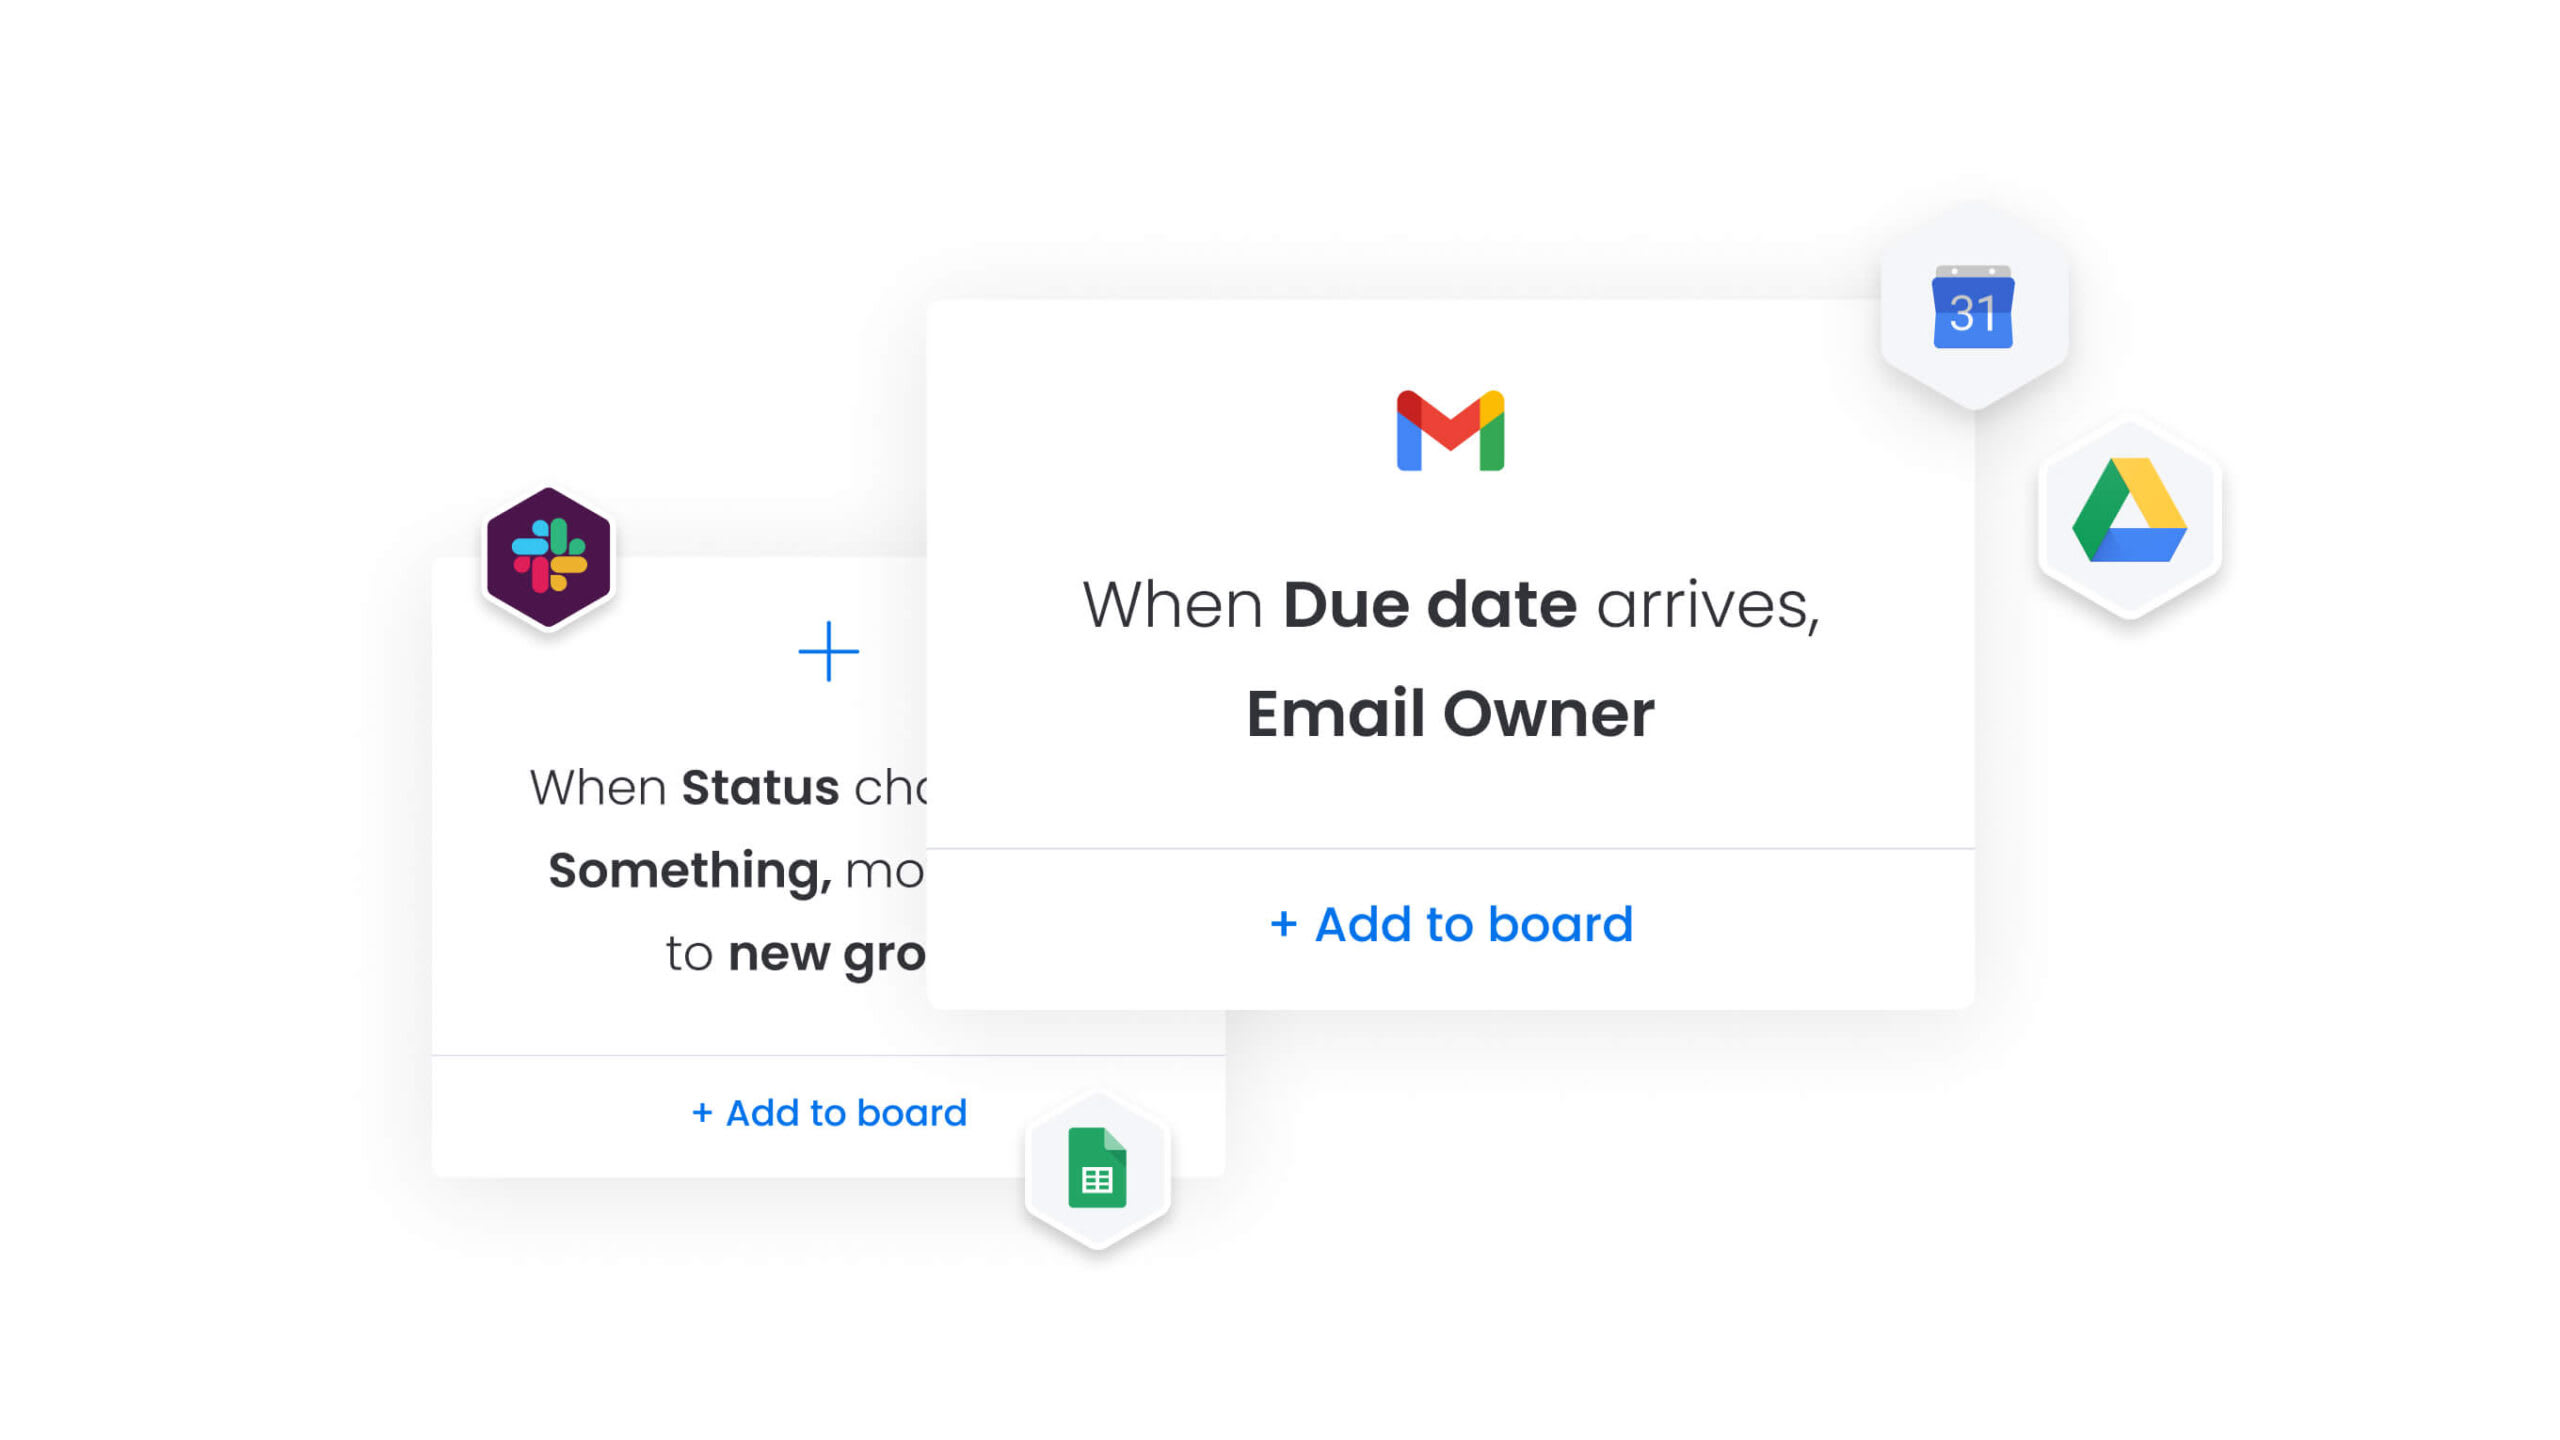
While spreadsheets calculate numbers, the platform automates processes with monday work management. It handles the “if this, then that” logic of business operations. It automatically assigns work based on capacity, moves items to different boards when phases complete, or sends Slack notifications when deadlines approach.
This automation removes the administrative repetitive work that typically bogs down spreadsheet maintenance, allowing the team to focus on execution.
Unite teams without losing spreadsheet simplicity
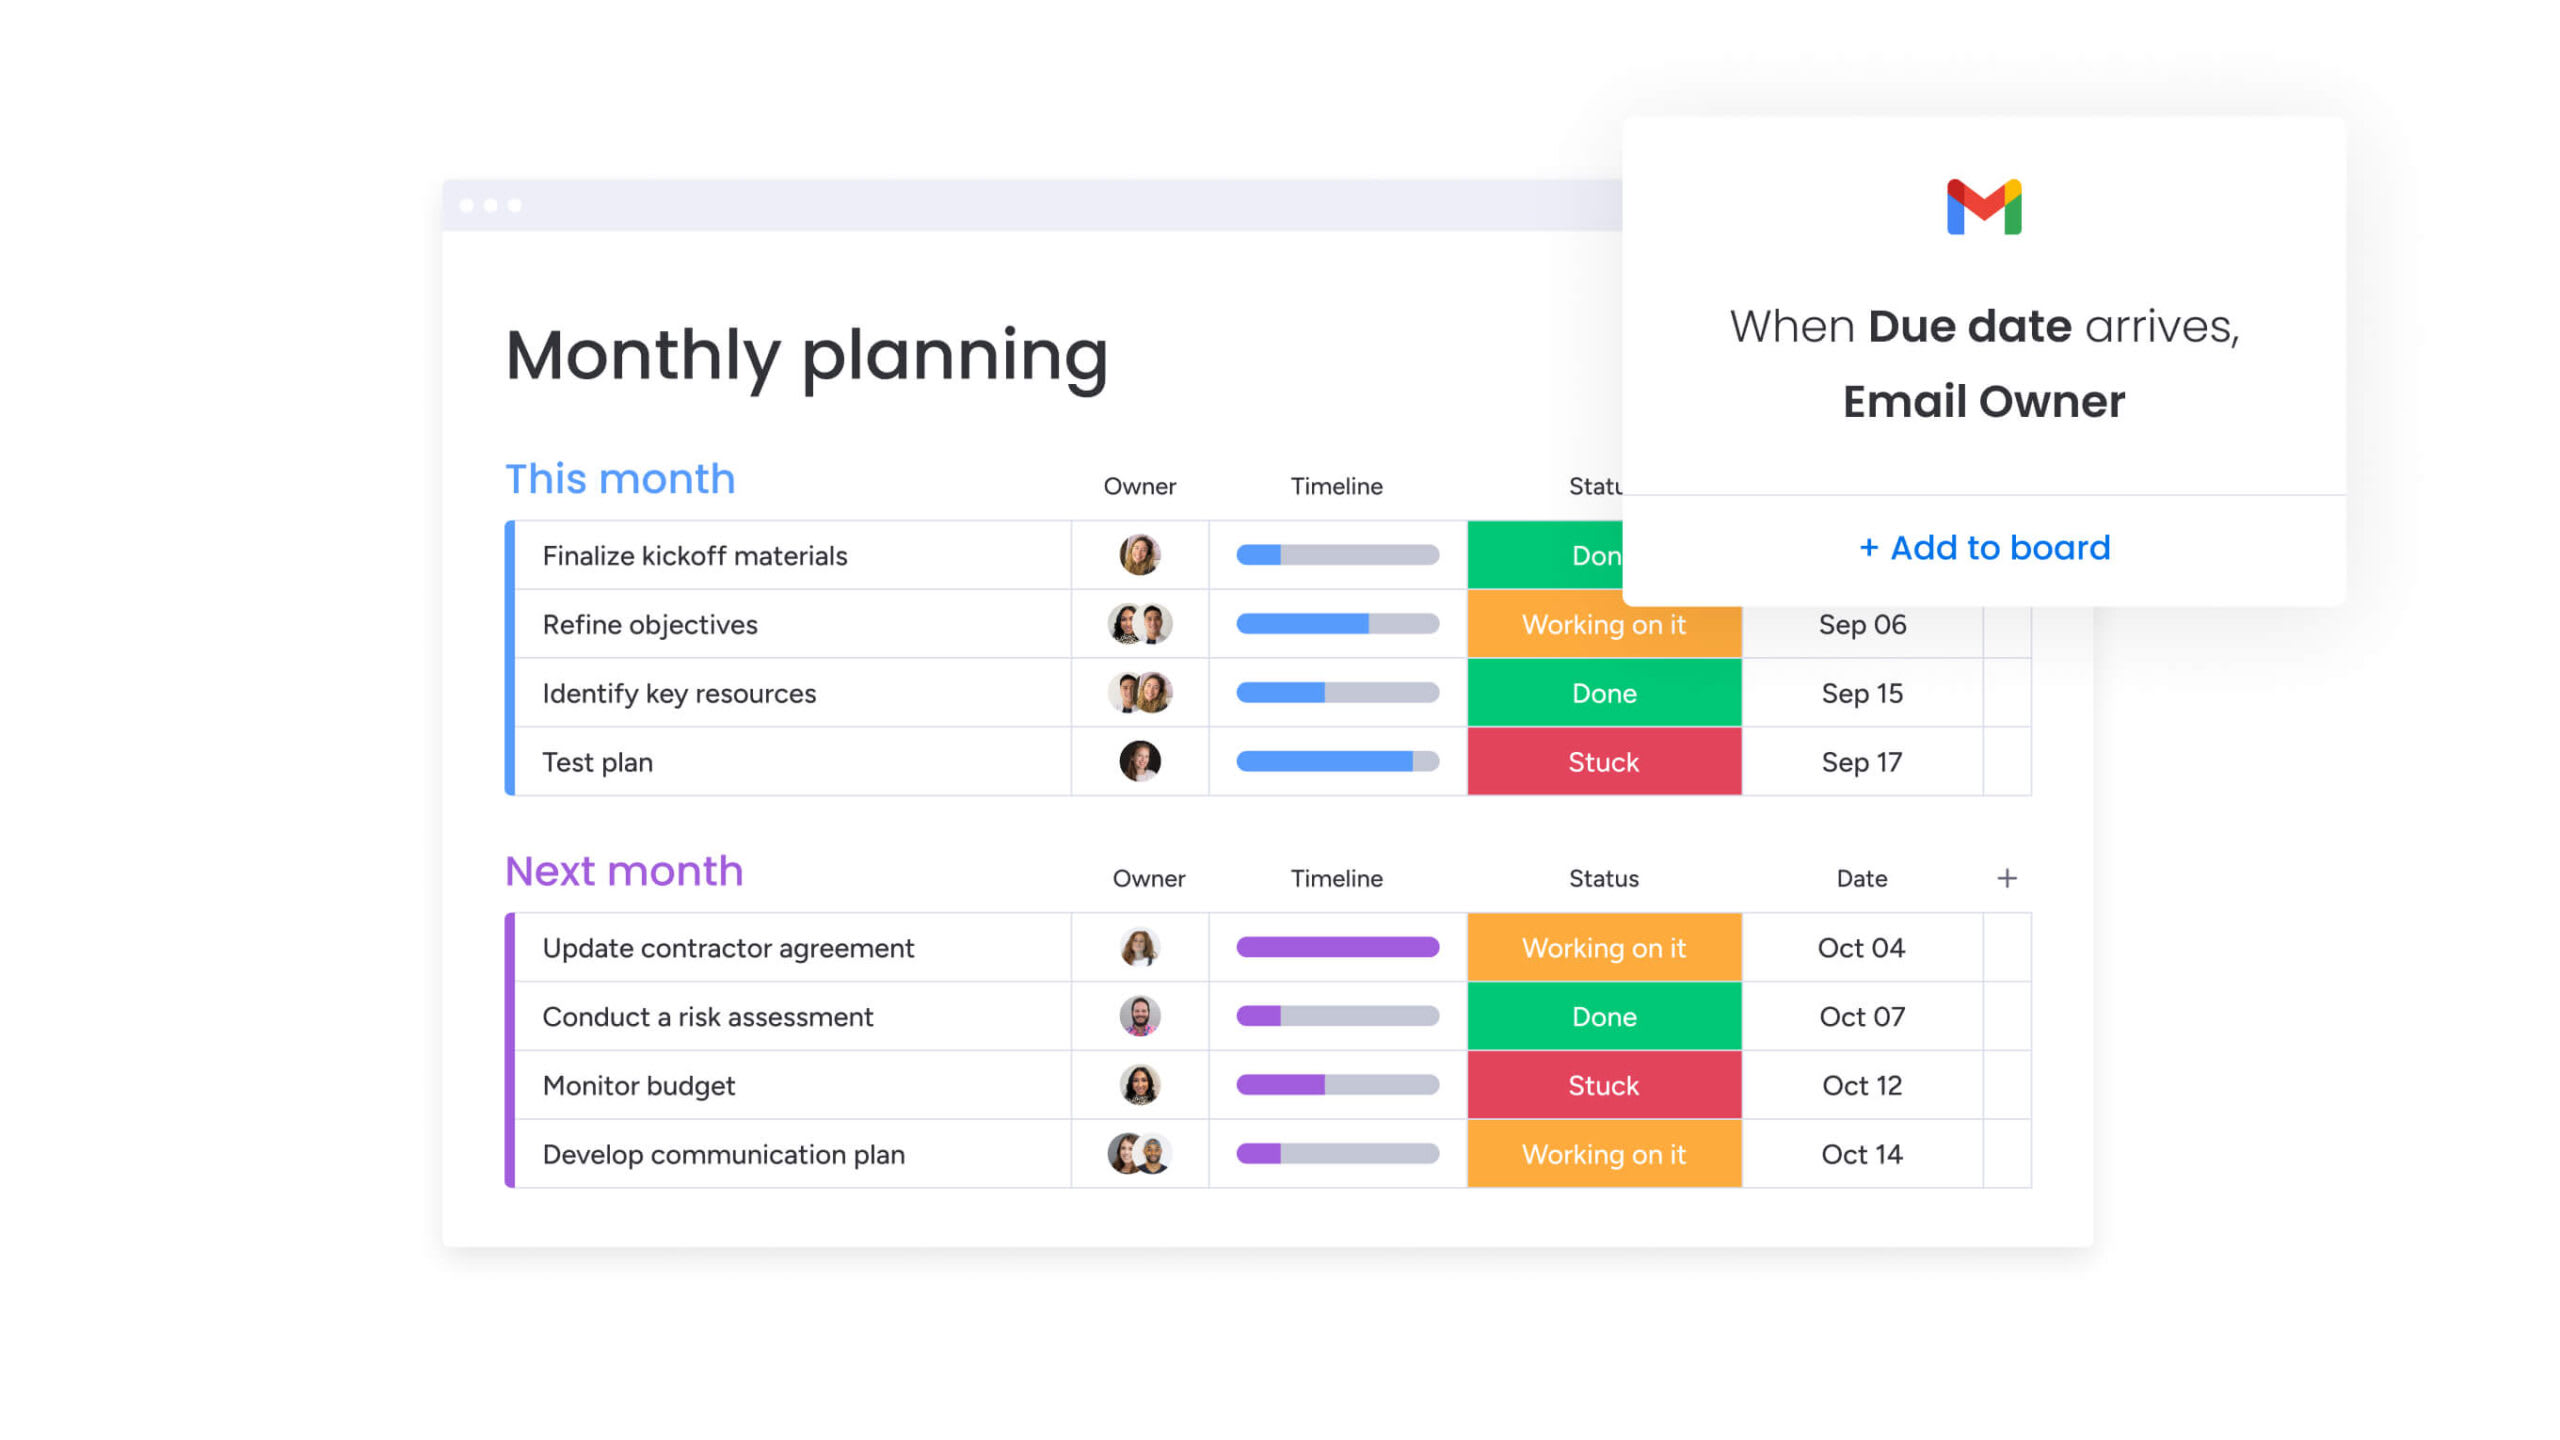
The platform bridges the gap between technical power and user adoption. Teams continue to work in a familiar table view that feels like a spreadsheet, adding columns, sorting rows, and filtering data. They gain the ability to switch views instantly. The same data can be viewed as a Gantt chart for project managers, a Kanban board for agile teams, or a Calendar for event planners.
This flexibility ensures that every department gets the view they need without creating data silos.
Scale from templates to enterprise systems
Starting with simple, customizable templates that mirror the ease of a spreadsheet, monday work management scales into a comprehensive portfolio management solution. Dashboard widgets aggregate data from dozens of boards into high-level executive reports. Enterprise-grade security, governance controls, and permissions ensure that as the organization expands, data remains secure and processes remain compliant.
“monday.com has been a life-changer. It gives us transparency, accountability, and a centralized place to manage projects across the globe".
Kendra Seier | Project Manager“monday.com is the link that holds our business together — connecting our support office and stores with the visibility to move fast, stay consistent, and understand the impact on revenue.”
Duncan McHugh | Chief Operations OfficerBuild workflows that grow with your business
Spreadsheet templates provide an excellent foundation for organizing work, but the most successful organizations recognize when it’s time to evolve. The transition from static files to dynamic workflows represents a strategic shift that unlocks new levels of productivity and collaboration.
Teams that make this transition maintain the simplicity and flexibility they love about spreadsheets while gaining the automation, integration, and scalability needed for sustainable growth. The key is choosing a platform that honors existing workflows while providing room to expand capabilities as needs evolve.
Organizations ready to move beyond spreadsheet limitations find that the right work management platform transforms how teams collaborate, automate routine tasks, and make data-driven decisions. This evolution doesn’t require abandoning familiar processes — it enhances them with the connectivity and intelligence that modern business demands.
Frequently asked questions
How do I choose between Excel and Google Sheets templates?
Choosing between Excel and Google Sheets templates depends on your primary needs. Excel is generally superior for massive datasets and complex financial modeling requiring advanced statistical formulas. Google Sheets is the stronger choice for workflows that prioritize real-time collaboration and cloud accessibility across distributed teams.
Can multiple people work on the same spreadsheet template simultaneously?
Traditional offline spreadsheets do not support simultaneous editing, leading to "locked file" errors. Cloud-based options like Google Sheets allow it, but complex templates often break when multiple users sort or filter data at the same time.
How often should I update my spreadsheet templates?
Templates should be reviewed quarterly to ensure that formulas remain accurate, named ranges cover new data, and the structure still aligns with any changes in your business processes or reporting requirements.
What's the difference between a template and a regular spreadsheet?
A template is a master file pre-configured with formulas, formatting, and structure designed to be saved as a new copy for each use. A regular spreadsheet is a single-use file containing specific data.
How do I protect formulas in shared templates?
You can lock specific cells or entire sheets within the spreadsheet settings, allowing users to edit only designated input fields while preventing them from accidentally deleting or altering the underlying formulas.
When should I move from spreadsheets to a work management platform?
Teams should migrate when they experience version control conflicts, require automated notifications and workflows, need granular permission settings, or when the manual effort to maintain the spreadsheet exceeds the value it provides.