
Three hours in a conference room. Sales insists they’re delivering complete lead information. Customer success claims they’re not getting what they need. IT maintains the handoff works perfectly. Everyone’s pointing fingers, but nobody can pinpoint where the customer onboarding process actually breaks down.
Enter the SIPOC template. This framework maps out the five essential elements of any business process: Suppliers (who provides resources), Inputs (what’s needed), Process (the high-level steps), Outputs (what’s produced), and Customers (who receives the results). Originally developed for manufacturing, SIPOC now helps enterprise teams spot exactly where workflows break down, no matter the industry.
This guide breaks down why SIPOC works, the right moments to deploy it, and the practical steps for creating diagrams that drive real process improvements. You’ll discover the essential building blocks, access ready-to-use templates for various use cases, and learn how to convert one-time documentation into dynamic workflows that evolve alongside your business.
Key takeaways
- Map your process boundaries first: define clear start and end points before diving into details to prevent scope creep and keep improvement projects focused on what matters.
- Build shared understanding across departments: use SIPOC’s visual framework to align cross-functional teams on who does what, reducing handoff confusion and departmental silos.
- Transform static documentation into live workflows: transform static documentation into live workflows: Connect your SIPOC maps to dynamic processes with automated handoffs, real-time visibility, and performance tracking.
- Focus on four to seven high-level steps maximum: keep your process mapping strategic rather than detailed to maintain clarity and avoid getting lost in operational weeds.
- Identify waste by mapping all outputs: document everything your process produces, including unintended results, to spot improvement opportunities and eliminate activities that create no customer value.
What is a SIPOC template?
A SIPOC template maps your business process within a single visual framework: Suppliers, Inputs, Process, Outputs, and Customers. This structure defines clear boundaries, helping teams identify where workflows begin, end, and can be improved.
As a high-level blueprint, SIPOC makes complex processes accessible to everyone from executives to frontline staff. Originally rooted in manufacturing, it is now essential for tech and service teams to align on execution and workflow management.
Ultimately, the template keeps stakeholders focused on scope rather than granular details. Consistent use of SIPOC creates a shared understanding across departments, reducing friction from unclear handoffs — much like a proof of concept validates logic before full-scale implementation.
What does SIPOC stand for?
Each SIPOC element plays a specific role in showing how work flows through your organization. Understanding these components helps teams spot where handoffs happen and where things break down.
The five SIPOC elements work together to create a complete picture of any business process:
- Suppliers: the internal or external entities providing necessary resources. In an employee onboarding process, this includes HR recruiters, IT procurement, and hiring managers.
- Inputs: the specific resources, data, or materials required to execute the process. For onboarding, inputs include signed offer letters, hardware specifications, and system access credentials.
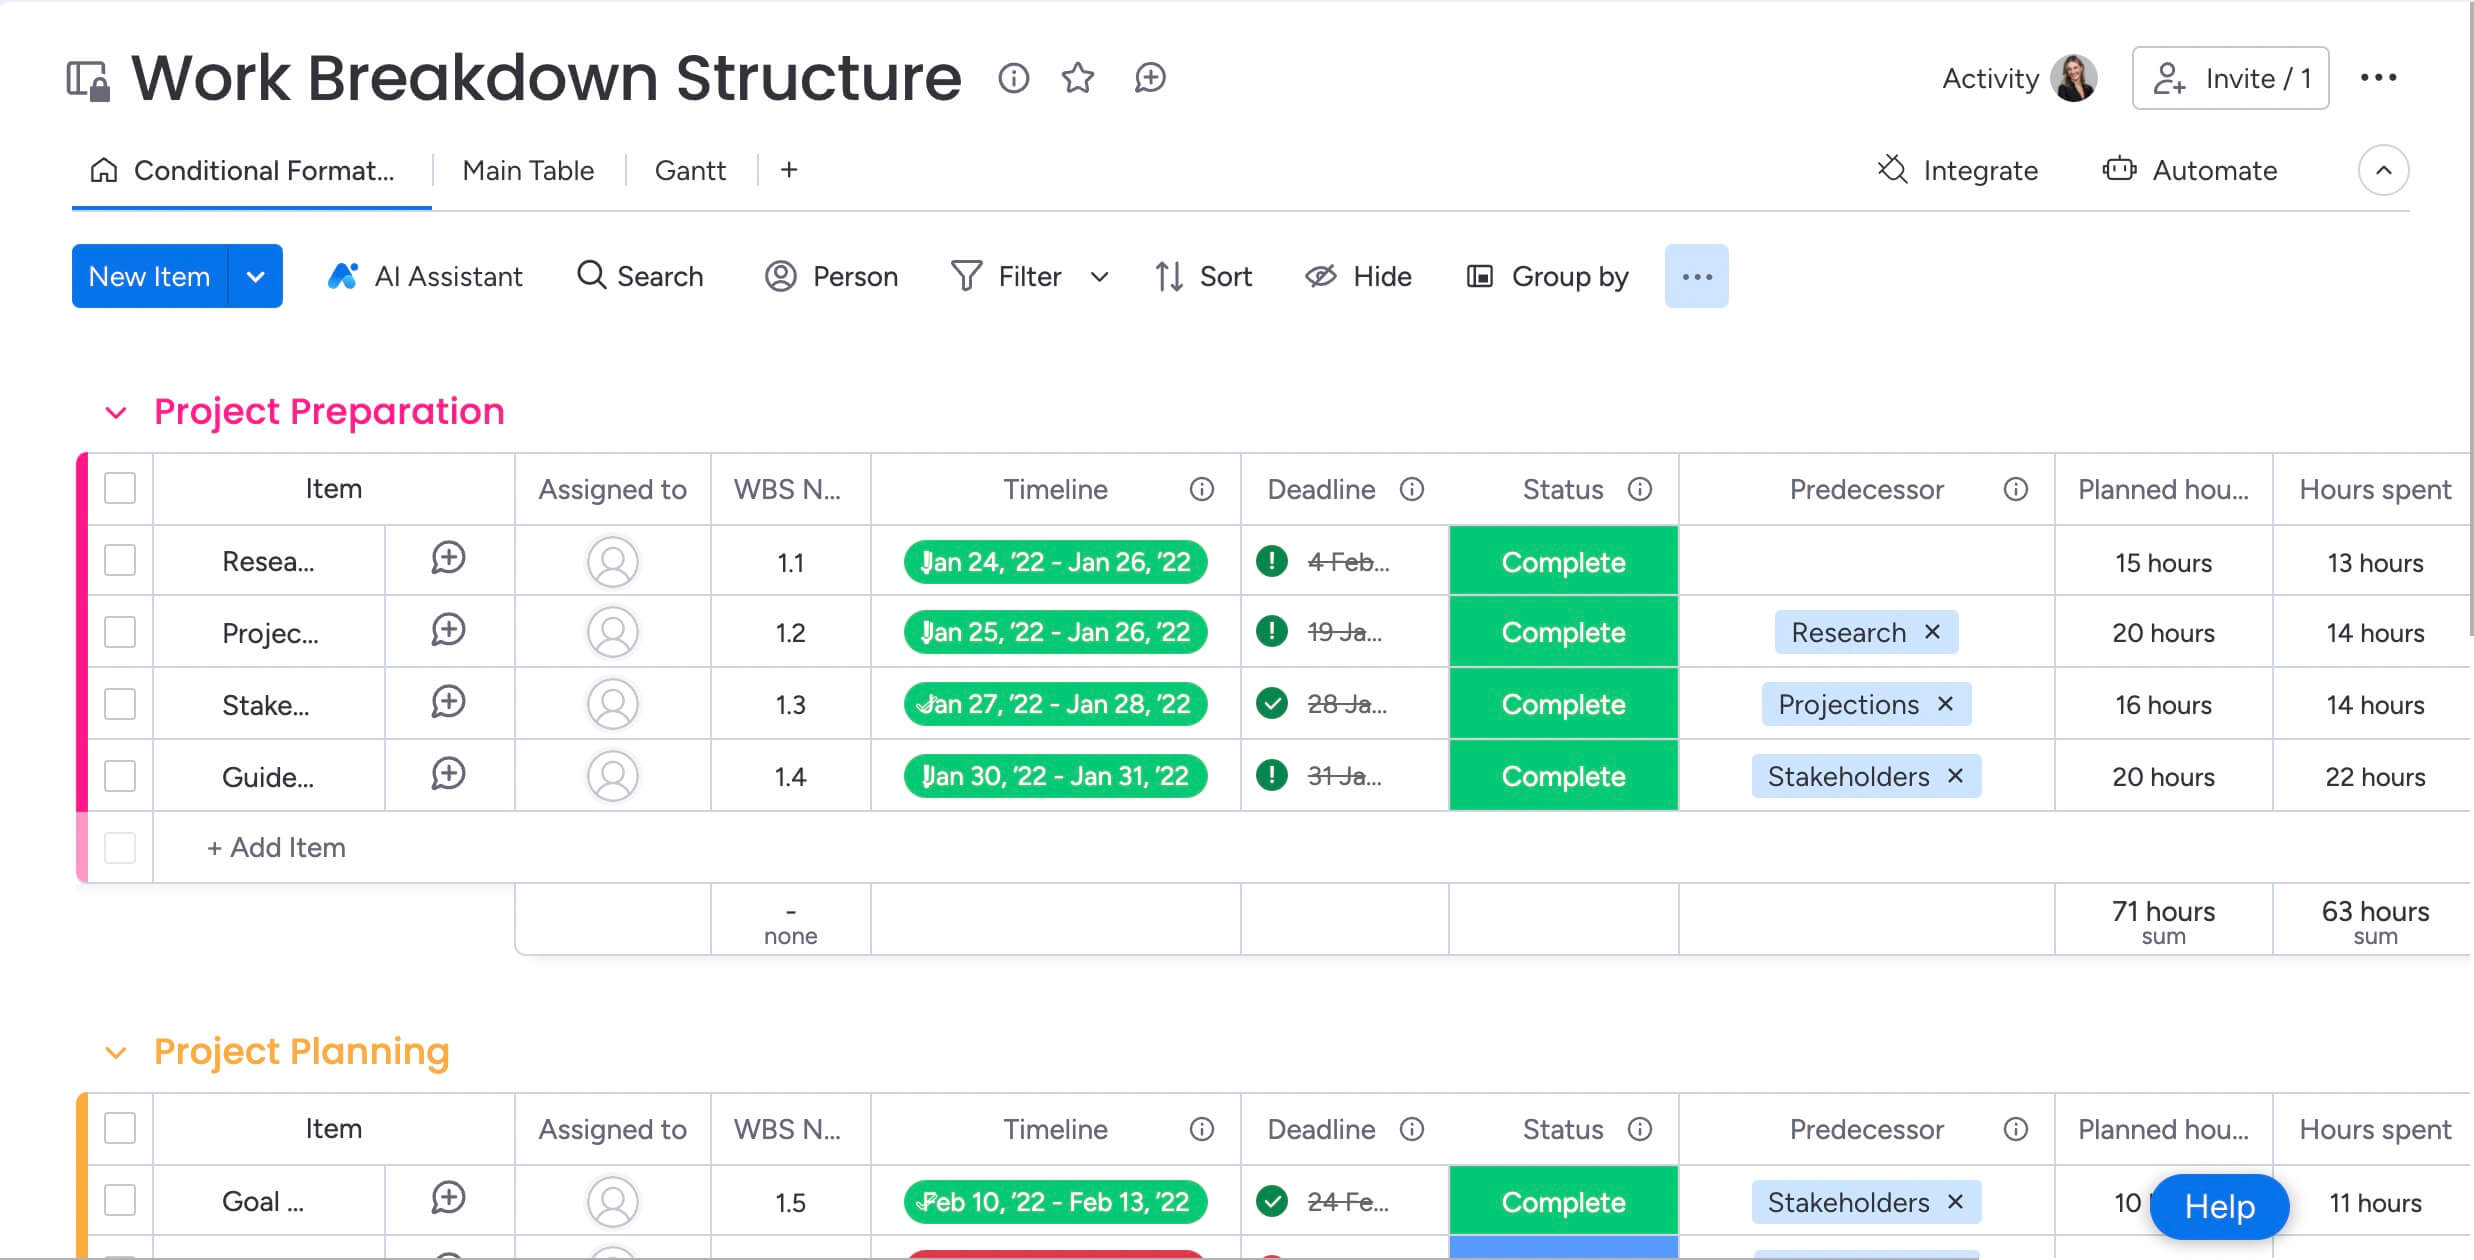
- Process: the high-level steps that transform inputs into outputs, typically restricted to four to seven major blocks like “Verify documentation,” “Provision equipment,” and “Conduct orientation.”
- Outputs: the tangible results or services produced by the process, including configured laptops, active email accounts, and completed training logs.
- Customers: the recipients of the outputs, including both the new hire (external to the process) and the department manager (internal customer).
Teams often map SIPOC backward, starting with the Customer, to make sure the process actually delivers what people need. This way, every process element ties back to what customers actually need.
SIPOC diagrams and detailed process maps do different things. Knowing when to use each keeps teams from wasting time on the wrong type of documentation. Match the tool to what you’re analyzing and who needs to see it.
| Aspect | SIPOC diagram | Detailed process map |
|---|---|---|
| Primary purpose | Strategic alignment and project scoping | Operational execution and troubleshooting |
| Granularity | High-level (four to seven major steps) | Granular (20+ steps, decisions, loops) |
| Time to create | one to two hours (collaborative session) | Days to weeks (observation and documentation) |
| Audience | Leadership, stakeholders, project leads | Operators, trainers, auditors |
| Best use | Project kickoffs, defining boundaries | Root cause analysis, standardization |
SIPOC is your starting point. Teams usually nail down the SIPOC first to set boundaries before diving into detailed mapping. This stops scope creep and makes sure everyone knows the process boundaries before going deeper.
5 key benefits of SIPOC diagrams for process teams
The diagram looks simple, but the value it delivers is huge. Organizations that use SIPOC well reduce project failure rates by establishing a shared understanding early. Research shows that structured, high-level process alignment can achieve 95% success rates in organizational redesign projects when proper frameworks are applied.
The benefits multiply when teams use SIPOC across different projects.
1. Build shared understanding before solutions
Teams often rush to fix a process before agreeing on what the process actually is. SIPOC stops teams from jumping to solutions before they agree on the current state.
When cross-functional teams gather to map a shared workflow, they often discover that the finance team’s “output” doesn’t match the operations team’s required “input.” Identifying these disconnects on a whiteboard costs nothing; discovering them after implementing new software is expensive.
2. Define process boundaries
Scope creep kills process improvement projects. Without boundaries, a project to improve “invoice processing” can easily balloon into an overhaul of the entire procurement strategy. Government data shows that poorly scoped projects can result in cost increases ranging from $6.1 million to $815.5 million, demonstrating the financial impact of inadequate project boundaries.
SIPOC needs clear Start and End Triggers. By documenting where the process starts and stops, teams set boundaries that keep the project from sprawling into unrelated areas.
3. Accelerate cross-functional alignment
Processes rarely live within a single department. They cut across finance, legal, sales, and support. SIPOC gives you a neutral view that doesn’t favor one department’s language over another’s.
The visual format helps technical and non-technical people get on the same page. An engineer and a marketing manager can both look at a SIPOC and see where they fit.
4. Design targeted improvement experiments
Good process improvement focuses on specific variables. Because SIPOC separates inputs from process steps, teams can test specific areas without changing everything.
A team might focus only on improving input quality from suppliers to see if it cuts errors—without touching the process steps.
5. Create audit-ready documentation
In regulated industries, documentation isn’t optional; it’s required. In fact, 77.17% of Medicaid improper payments are due to insufficient documentation, highlighting the critical importance of clear, standardized process documentation like SIPOC provides. SIPOC gives you a standard format that keeps auditors happy and stays easy for business users to read.
Unlike complex technical diagrams, a SIPOC is easy to read and shows you control your inputs, outputs, and process flows.
When to use SIPOC analysis?
Timing matters when you run a SIPOC workshop. While SIPOC works at any stage, certain moments give you the biggest payoff. Knowing when to use SIPOC helps teams get the most from their process improvements.
- During DMAIC define phase: in Six Sigma’s DMAIC framework (Define, Measure, Analyze, Improve, Control), SIPOC anchors the Define phase by helping project leads map out the entire process and define what’s in scope before teams measure performance or dig into root causes.
- Project kickoff and scoping: the first meetings of any cross-functional initiative, during project initiation, are the ideal time for SIPOC creation; it’s a great icebreaker that gets the team aligned while setting project boundaries and letting stakeholders raise concerns on the spot.
- Cross-functional process alignment: when handoffs between departments break down, SIPOC is your go-to diagnostic tool that shows exactly where one department’s output becomes another’s input, revealing where information is lost, corrupted, or delayed.
- Compliance and audit preparation: when you’re prepping for audits or governance reviews, SIPOC diagrams show auditors you’ve got process control and understand your supply chain, how you transform inputs, and what you deliver.
How to create a SIPOC diagram in 7 steps?
Creating a SIPOC is a collaborative exercise, not a solo documentation task. It needs input from the people who actually do the work. Follow these steps to build a SIPOC that captures your process and leads to real improvements.
Step 1: define process start and end points
Firstly, the most critical step involves establishing clear boundaries. Teams must reach consensus on the specific trigger that initiates the process and the definitive endpoint that concludes it.
For a help desk process, the start point is “User submits ticket,” and the end point is “Ticket marked resolved.” The scope should focus on the core process, setting aside upstream activities like “User experiences bug” or downstream actions like “User fills out satisfaction survey.”
Step 2: map 4-7 high-level process steps
The objective is to provide a high-level summary rather than granular details. The process column should capture only the major phases where value is added to the workflow.
Structure each step using verb-noun format, such as “Review Application” or “Approve Budget.” When teams identify more than seven steps, consolidate related activities into broader process phases to maintain the strategic perspective.
Step 3: identify all process outputs
Outputs are everything the process produces, intended or otherwise. This includes:
- Primary outputs: the main deliverable.
- Secondary outputs: data records, updated database entries.
- Waste outputs: scraps, error logs, rejected applications.
Spotting waste outputs now helps you find improvement opportunities later.
Step 4: define customers for each output
Every output must have a destination. If an output has no customer, it’s likely waste. Consider:
- External customers: the end-user or client.
- Internal customers: the downstream department.
- Regulatory customers: auditors or agencies that require specific reports.
Step 5: list required process inputs
Now that we’ve defined the customers for each output, work backward from the process steps. What do you physically or digitally need to complete these steps? This includes:
- Information: data, specs, instructions.
- Materials: raw goods, parts, physical documents.
- Resources: required software or machinery.
Step 6: connect suppliers to each input
Identify the source of every input. This shows you where you’re dependent on others—and where risk lives. Consider:
- External suppliers: vendors, contractors, partners.
- Internal suppliers: upstream departments, databases, automated systems.
- Environmental suppliers: market trends or regulatory bodies that supply rules or requirements as inputs.
Step 7: validate with process stakeholders
Finally, SIPOC drafted in a conference room is a hypothesis. It must be tested against reality.
Review the diagram with the people who actually do the work. Confirm with customers that they actually receive and value the listed outputs. Confirm suppliers are aware of the inputs they’re expected to provide.
Essential SIPOC components
Digging deeper into each component reveals insights basic documentation misses. Understanding how each element works helps teams build better process maps, document workflows, and spot where to improve.
- Suppliers: analyzing suppliers shows where your supply chain is vulnerable. By mapping them to critical inputs, teams see where they are at risk. If a single internal team supplies most inputs, they become a bottleneck risk. Teams can track supplier performance and catch issues early using modern platforms like monday work management.
- Inputs: inputs determine process quality. The principle of “Garbage In, Garbage Out” applies here. Analyzing inputs helps teams set acceptance criteria, such as ensuring “Customer Data” is complete and accurate. Teams can standardize requirements and use automated checks to catch quality issues early.
- Process: this is where inputs become outputs. By keeping it high-level, SIPOC lets you stay flexible on how work gets done, as long as inputs and outputs stay consistent. This flexibility allows teams to adapt fast without breaking the overall process.
- Outputs: outputs are where the value lives. Analyzing them helps teams distinguish between what they think they produce and what creates value. If a process produces a report nobody reads, the SIPOC flags it for removal. Teams can track output quality and satisfaction metrics directly alongside documentation through monday work management.
- Customers: customer analysis keeps the SIPOC focused on delivering value. “Customer” is defined as anyone who receives an output. Understanding internal customer needs often reveals the biggest efficiency gains. When teams nail down these needs, they can tune processes to deliver exactly what’s needed.
SIPOC template types for different needs
Different organizational challenges require different visual frameworks. While the core logic remains the same, the format adapts to the complexity of the problem. Choosing the right template variant ensures your SIPOC analysis matches the depth and scope of your improvement initiative.
Basic SIPOC diagram template
The standard five-column layout is the workhorse of process improvement. It works best for:
- Initial discovery: when teams are new to a process.
- Simple linear flows: with minimal branching.
- Workshop settings: where it fits easily on a whiteboard or shared digital canvas.
This template provides the foundation that teams can build upon as their process understanding matures.
SIPOC+CM template with constraints and measures
For complex operational environments, the SIPOC+CM adds two critical layers of analysis:
- Constraints: budget caps, regulatory rules, or technology limits that bound the process.
- Measures: Key Performance Indicators used to track success like cycle time, defect rate, or Net Promoter Score.
This template is essential for processes undergoing rigorous performance optimization or those operating in highly regulated environments. Teams using solutions like monday work management can embed these constraints and measures directly into their workflows, creating automated alerts when thresholds are approached or exceeded.
Industry-specific SIPOC examples
Different industries adapt SIPOC to their unique requirements:
- Healthcare: focuses heavily on patient safety constraints and regulatory outputs.
- Financial services: emphasizes risk management and data integrity.
- Manufacturing: focuses on physical material inputs and tangible product outputs.
- Technology: adapts SIPOC for software development lifecycles where inputs are “User Stories” and outputs are “Deployed Features”
Traditional SIPOC diagrams suffer from a fundamental limitation: they’re static artifacts trapped in presentation slides or spreadsheets. As soon as the meeting ends, the diagram disconnects from the actual work. Organizations using monday work management bridge this gap by transforming the SIPOC framework into a living, operating system.
By digitizing SIPOC elements, organizations convert a passive map into an active management system. Here’s how the transformation works:
| Aspect | Static SIPOC document | Dynamic SIPOC on monday work management |
|---|---|---|
| Updates | Manual, periodic, often neglected | Automatic, real-time, triggered by work |
| Visibility | Hidden in drive folders | Visible on shared dashboards |
| Handoffs | Rely on email/meetings | Automated notifications and status changes |
| Measurement | Retroactive data gathering | Live reporting on cycle time and throughput |
| Connection | Disconnected from daily work | Directly linked to executing workflows |
Teams organize boards where groups represent process phases, items represent inputs and outputs, and columns track supplier status and customer delivery. Automation recipes replace manual friction. When a Process Step status changes to “Done,” the system automatically notifies the Customer or triggers the next phase, ensuring the flow defined in the SIPOC is enforced digitally.
Instead of manually calculating process performance, dashboard widgets visualize the Measures from the SIPOC+CM model instantly. Leaders see bottlenecks as they happen, enabling them to make proactive adjustments in real time. Stakeholders discuss inputs and outputs directly within the item context, preserving the context often lost in email chains.
The platform’s AI capabilities take SIPOC management even further:
- AI Blocks: can automatically categorize inputs by type or urgency.
- Summarize complex process documentation: into clear SIPOC elements.
- Extract key information: from existing documents to populate your SIPOC template.
This reduces the time spent on initial creation and ongoing maintenance while improving accuracy.
“monday.com has been a life-changer. It gives us transparency, accountability, and a centralized place to manage projects across the globe".
Kendra Seier | Project Manager“monday.com is the link that holds our business together — connecting our support office and stores with the visibility to move fast, stay consistent, and understand the impact on revenue.”
Duncan McHugh | Chief Operations OfficerTurn SIPOC insights into operational excellence
SIPOC templates establish the foundation for process clarity, yet their true value materializes when organizations transition from documentation to execution. Teams that implement SIPOC effectively achieve measurable improvements in cross-functional alignment, reduced handoff delays, and accelerated project delivery cycles.
The framework’s strength resides in its simplicity and collaborative approach. By convening stakeholders to map suppliers, inputs, processes, outputs, and customers, organizations establish shared understanding that bridges departmental boundaries. This alignment serves as the foundation for targeted improvements and sustained operational excellence.
Organizations prepared to convert their static process maps into dynamic management systems will find that monday work management delivers the infrastructure to operationalize SIPOC insights. The platform integrates process documentation directly with daily workflows, ensuring that the clarity derived from SIPOC analysis converts into measurable business outcomes.
Frequently asked questions
What does SIPOC stand for?
SIPOC stands for Suppliers, Inputs, Process, Outputs, and Customers. It's a process improvement acronym used to map the flow of value and resources through a business system at a high level.
How is SIPOC different from value stream mapping?
SIPOC provides a high-level structural overview of process elements, while Value Stream Mapping is a detailed analysis of material and information flow. VSM specifically focuses on time, value-add ratios, and waste identification, whereas SIPOC establishes process boundaries and relationships.
Can SIPOC templates work for service industries?
SIPOC is highly effective for service industries like finance, healthcare, and technology. In these contexts, Inputs are often data or information, and Outputs are decisions, reports, or completed digital transactions rather than physical products.
How many process steps should a SIPOC include?
A standard SIPOC diagram should contain between 4 and 7 high-level process steps. Exceeding seven steps usually indicates the team is getting too granular and should move to a detailed process map instead.
What is the SIPOC+CM variant?
SIPOC+CM extends the basic framework by adding Constraints and Measures. Constraints include limitations like budget or regulations, while Measures are KPIs that track process performance. This variant is used when teams need to manage performance and compliance alongside process flow.
When should teams update their SIPOC diagrams?
Teams should update SIPOC diagrams quarterly or immediately following significant changes in technology, organizational structure, or regulatory requirements. Regular reviews ensure the documentation remains an accurate reflection of operations and continues to provide value for process improvement efforts.