You’re presenting three project proposals to leadership. One promises $2 million in revenue over five years. Another delivers $1.5 million over three years. The third generates $800,000 in just 18 months. Which creates the most value for your organization? Without accounting for timing, risk, and the cost of capital, you’re comparing apples to oranges.
That’s where Net Present Value (NPV) comes in. It translates future cash flows into today’s dollars, giving you a real comparison. Instead of guessing which project wins, you get a clear answer based on actual value creation. .
Join us for a few minutes and explore this guide where you’ll learn the NPV formula, a 5-step calculation process, and how to interpret results for go/no-go decisions.
We’ll also take you through how to spot common calculation mistakes and you’ll see how flexible work management platforms can automate NPV analysis across your entire portfolio.
Key takeaways
- Calculate NPV to make smarter project decisions: use the formula NPV = Σ [CFt / (1 + r)^t] – Initial Investment to compare projects and prioritize the ones that create the most value.
- Track NPV throughout your project’s lifecycle: recalculate at major milestones and budget reviews to catch problems early and decide whether to continue, modify, or stop the project.
- Transform static NPV calculations into dynamic insights: a Work OS can automate NPV tracking with real-time dashboards, AI-powered risk detection, and portfolio-wide visibility for data-driven decisions.
- Avoid common NPV mistakes that destroy value: include all hidden costs like training and maintenance, use the correct discount rate from your finance team, and account for project dependencies.
- Positive NPV doesn’t guarantee project approval: consider strategic value, regulatory requirements, and portfolio balance when making go/no-go decisions beyond just the financial numbers.

Net Present Value (NPV) is the difference between what money comes in and what goes out, adjusted for when those cash flows actually happen. Project managers use this financial metric to determine whether a proposed project will create or destroy value for the organization. Unlike simple cost-benefit analyses, NPV accounts for timing, showing you what a project’s really worth.
It’s helpful to consider NPV as a currency converter for time. It converts future earnings into “today’s dollars” so you can make apples-to-apples comparisons. A project promising $500,000 in revenue five years from now isn’t worth the same as $500,000 today.
Understanding the time value of money
The core concept behind NPV is the time value of money: a dollar available today is worth more than a dollar promised in the future. Money today can be invested and grown. Money promised later can’t. This principle is quantified by current inflation rates, with the CPI-U increasing 2.7% over the 12 months ending December 2025, demonstrating the purchasing power erosion that NPV properly adjusts for.
Here’s what this means for you: you can’t weigh costs or benefits five years out the same as those happening today. A project generating $100,000 in year one beats one generating the same amount in year five, even if the total revenue matches.
Why project managers need NPV analysis
NPV analysis provides a standardized method for comparing projects with different durations and cash flow patterns. Instead of relying on gut feel, you can show leadership exactly why an investment makes sense. How do you compare a two-year project to a seven-year one?
By quantifying value creation in present terms, managers can prioritize resources for the most profitable ventures and make defensible portfolio decisions. NPV connects what your team does every day to the company’s financial goals.
Key components of project NPV
To calculate NPV, you need accurate data on four key elements: Here’s what each piece means:
- Initial investment: the total upfront capital required to launch the project, including equipment, software licenses, and initial labor costs.
- Future cash flows: the projected inflows (revenue, savings) and outflows (maintenance, operating costs) expected throughout the project’s life.
- Discount rate: the percentage rate used to convert future cash flows into present value, reflecting the organization’s cost of capital and risk appetite.
- Time periods: the specific intervals (usually years) over which the cash flows occur, defining the project’s financial horizon.
The NPV formula explained for projects
The formula for Net Present Value is NPV = Σ [CFt / (1 + r)^t] – Initial Investment. The math looks intimidating, but it’s just addition with a twist. Here’s what happens: you shrink each future cash flow to today’s value using the discount rate, add them up, then subtract your initial investment.
Breaking down each formula component
Let’s break down what each variable means: Each piece matters:
- CFt (Cash flow in period t): the net cash flow for a specific time period, calculated by subtracting costs from revenue or savings in that same period.
- r (Discount rate): the rate of return the organization requires to justify an investment, acting as a hurdle rate that projects must clear.
- t (Time period): the specific year or period in which the cash flow occurs; as t increases, the present value of the cash flow decreases
- Initial investment: the baseline cost subtracted at the end of the summation to determine net value.
Choosing the right discount rate
The discount rate is your most important input. Most project managers use their company’s Weighted Average Cost of Capital (WACC), which is the average rate the company pays to finance its assets.
For standard business projects, this rate often falls between 8% and 12%, with current sector benchmarks showing rates like 9.38% for Auto & Truck, 9.51% for Retail (Building Supply), and 9.71% for Computers/Peripherals.
For riskier projects, add a risk premium to reflect the uncertainty. Mandatory compliance projects might use lower rates. Current market conditions show the U.S. 10-year Treasury yield at 4.24% as of January 16, 2026, providing a widely used risk-free rate reference when setting corporate discount rates.
Consulting with your finance team ensures the rate aligns with corporate standards and produces consistent results across your portfolio.
Project cash flow essentials
Your NPV is only as good as your cash flow projections. You need to catch every cost and benefit, not just the obvious ones. Missing a cost category can dramatically skew your results.
Make sure you include:
- Revenue increases: direct income generated by the new product or service.
- Cost savings: reductions in operational expenses due to efficiency gains or automation.
- Implementation costs: one-time expenses for setup, training, and deployment.
- Operational costs: recurring expenses for maintenance, subscriptions, and support.
- End-of-project values: salvage value of equipment or assets at the project’s conclusion.
How to calculate NPV: 5 simple steps
Calculating NPV follows a clear sequence that tells your project’s financial story. Follow these five steps to turn estimates into one clear number that drives your investment decisions.
Step 1: map all project cash flows
Create a comprehensive timeline of all money flowing in and out of the project by year. List the initial outflow (Year 0) and the net cash flow for each subsequent year. Don’t forget hidden costs like training, change management, and opportunity costs.
A simple table keeps everything organized, separating what you spend from what you earn. This map drives everything else.
Step 2: select your discount rate
Once you’ve mapped cash flows, plug in your discount rate. This rate depends on your company’s requirements, the project’s risk level, and industry standards. Use the same rate across projects for fair comparisons.
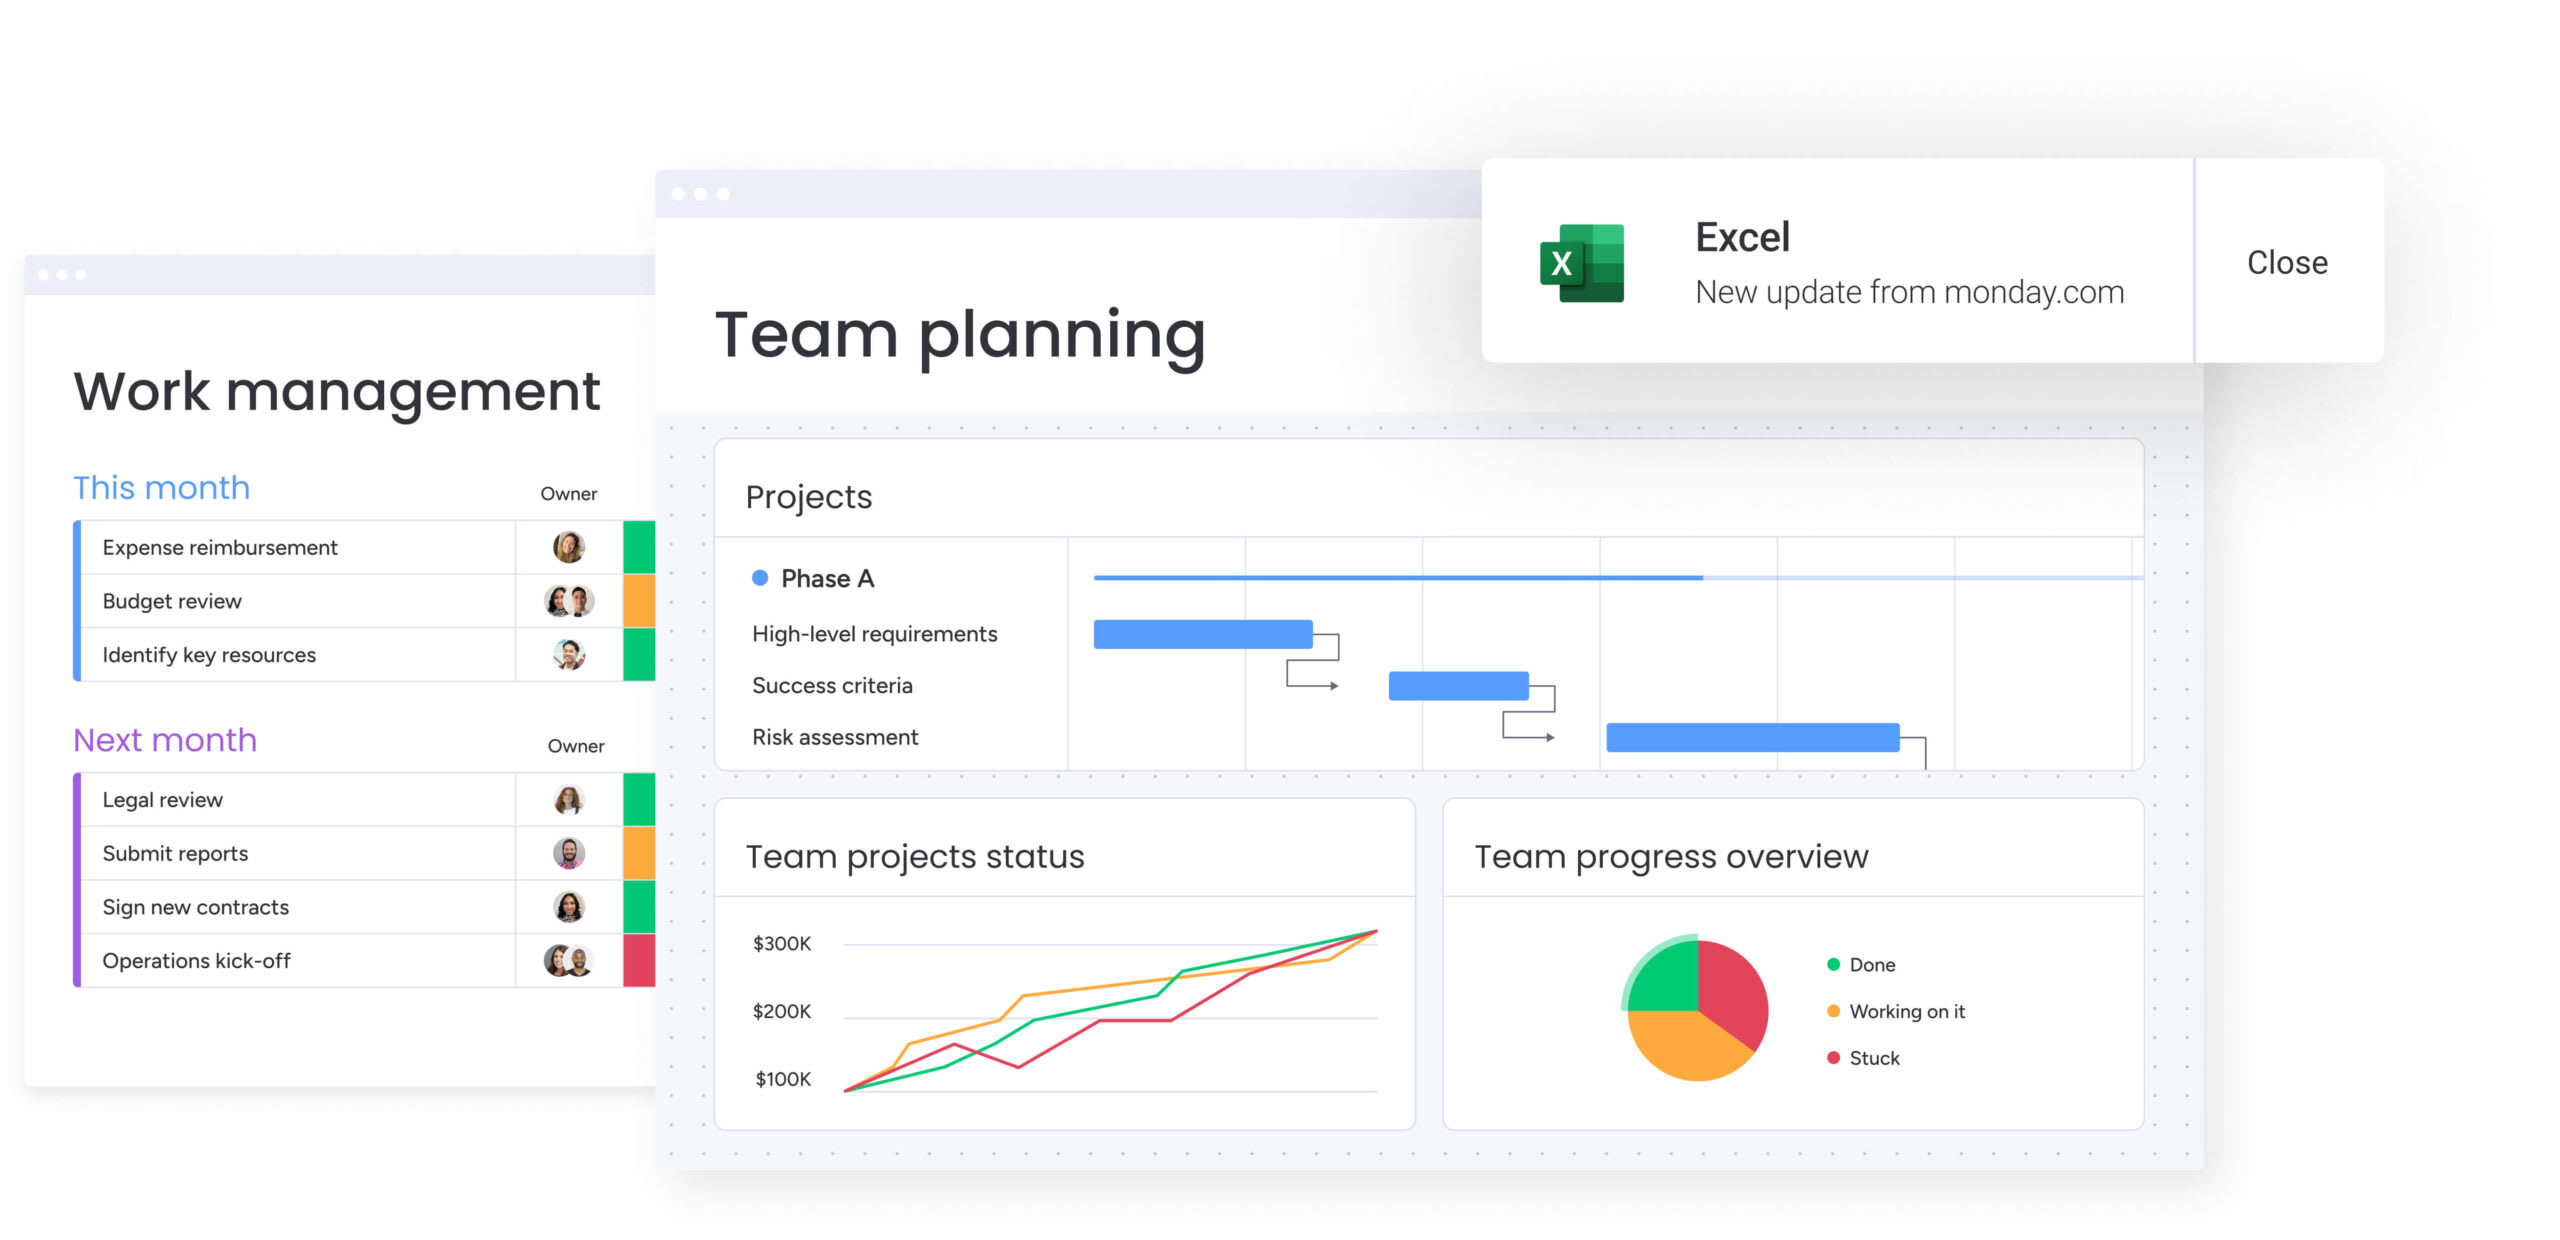
Organizations managing multiple initiatives benefit from standardizing these rates across project boards. Intelligent solutions like monday work management helps teams track and apply consistent rates across all projects.
Step 3: calculate present values
Now discount each future cash flow to its present value. Divide the cash flow of a specific year by (1 + discount rate) raised to the power of that year. For example, $1,000 received in Year 1 with a 10% discount rate is worth $909.09 today.
Repeat this calculation for every year of the project’s life. Each subsequent year’s cash flow will be worth less in present terms, reflecting the time value of money.
Step 4: sum the present values
Add these figures together after calculating the present value for each individual year. This sum represents the total gross present value of all future benefits the project is expected to generate. This figure reflects what the future revenue stream is worth right now, before accounting for the cost to acquire it.
Step 5: subtract initial investment
Subtract the initial investment from the sum of the present values calculated in Step 4. The result is the Net Present Value. A positive result indicates that the project is projected to create value over and above its cost and the required return. A negative result suggests the project will destroy value or fail to meet the organization’s return threshold.
Try monday work management
Understanding positive vs negative NPV
Interpreting the final NPV figure is about more than checking if the number is above zero. It involves understanding the strategic implications of the financial data and how it should influence your decisions. The NPV result provides a foundation for making informed go/no-go decisions that align with organizational objectives.
What positive NPV means for projects
A positive NPV indicates that the project is expected to generate more value than it costs, measured in today’s dollars. It signifies that the investment will yield a return higher than the discount rate used in the calculation. For the organization, this translates to increased profitability, improved competitive advantage, and a stronger financial position.
In a resource-constrained environment, projects with higher positive NPVs generally take precedence. They offer the greatest contribution to organizational wealth and represent the most efficient use of capital.
When to consider negative NPV projects
A negative NPV does not automatically disqualify a project. There are scenarios where proceeding with a financial loss is necessary for broader business objectives. Projects driven by regulatory compliance, safety requirements, or environmental standards often have negative NPVs but are mandatory for operation.
Strategic loss leaders may be approved despite negative projections because they open new markets or block competitors. These decisions require explicit executive approval and documented strategic justification.
Making go/no-go decisions
The decision framework for NPV is generally straightforward but requires nuance. Consider these guidelines when evaluating your NPV results:
- Positive NPV projects: typically “go” decisions, subject to budget availability.
- Negative NPV projects: generally “no-go” unless a specific strategic or regulatory case exists.
- Zero NPV projects: marginal cases where non-financial factors like employee satisfaction, brand reputation, or strategic alignment become the deciding factors.
“monday.com has been a life-changer. It gives us transparency, accountability, and a centralized place to manage projects across the globe".
Kendra Seier | Project Manager“monday.com is the link that holds our business together — connecting our support office and stores with the visibility to move fast, stay consistent, and understand the impact on revenue.”
Duncan McHugh | Chief Operations OfficerNPV vs other financial metrics
Project managers often encounter multiple financial metrics. Understanding when to use NPV versus alternatives ensures the right measurement is applied to the right decision. Each metric provides different insights into project value and performance.
NPV vs. IRR for projects
Internal Rate of Return (IRR) calculates the percentage rate of return a project is expected to generate. While useful, it can be misleading when comparing projects of different sizes.
| Feature | Net present value (NPV) | Internal rate of return (IRR) |
|---|---|---|
| Output type | Absolute dollar value (e.g., $50,000) | Percentage (e.g., 15%) |
| Project size | Handles different project sizes well | Biased toward smaller projects with high % returns |
| Reinvestment | Assumes reinvestment at discount rate | Assumes reinvestment at IRR (often unrealistic) |
| Best use | Determining total value creation | Comparing efficiency or yield |
NPV vs payback period
The payback period measures how long it takes to recover the initial investment. It’s a simple metric but has significant flaws. Payback period ignores the time value of money and completely disregards any cash flows that occur after the investment is recovered.
NPV considers the entire lifespan of the project and the timing of every dollar, making it a far more accurate measure of total profitability. A project with a long payback period might still have an excellent NPV if the later-year returns are substantial.
NPV vs ROI analysis
Return on Investment (ROI) is a simple ratio of net profit to cost, expressed as a percentage. While ROI is easy to communicate, it doesn’t account for the duration of the project or the time value of money. A 20% ROI over one year is very different from a 20% ROI over five years.
NPV provides the absolute dollar value created, which is often more useful for understanding the magnitude of the financial impact on the organization. Use both metrics together for a complete picture.
How to ensure accurate NPV calculations
Errors in NPV calculation can lead to poor investment decisions. Awareness of these common pitfalls helps project managers ensure their analysis is robust and reliable. Avoiding these mistakes protects your organization from costly miscalculations and missed opportunities.
Underestimating total project costs
A frequent error is omitting indirect or hidden costs from the cash flow map. Project managers often account for hardware and software but overlook training, organizational change management, system integration, ongoing maintenance, and the opportunity cost of pulling staff from other work.
A comprehensive cost checklist is necessary to capture the true total cost of ownership. What costs might you be missing in your current calculations?
Using incorrect discount rates
Applying the wrong discount rate skews the entire analysis. Using a rate that is too low makes risky projects appear artificially attractive, leading to value destruction. Using a rate that is too high punishes viable projects, causing the organization to miss growth opportunities.
Consistency is key. Project managers must align with finance teams to use the authorized rate for their specific project type. Centralizing rate documentation helps ensure all project evaluations use standardized benchmarks for consistency.
Ignoring risk factors
NPV calculations are based on assumptions, and assumptions carry risk. A common mistake is treating projected cash flows as guaranteed facts. Project managers must incorporate uncertainty through sensitivity analysis or by using risk-adjusted discount rates.
By using integrated risk management capabilities, teams can identify and quantify potential threats, helping adjust cash flow projections to reflect a more realistic, risk-weighted scenario.
Missing hidden dependencies
Projects rarely exist in a vacuum. NPV calculations often fail to account for interdependencies, such as shared resources, sequential timing requirements, or portfolio effects where one project cannibalizes the revenue of another.
Identifying these links ensures that the cash flow projections for one project don’t inadvertently double-count benefits or ignore costs incurred elsewhere in the portfolio.
Tracking NPV throughout project execution
NPV is not a static figure calculated once during the proposal phase. It’s a living metric that evolves as the project progresses and real data replaces estimates. Continuous monitoring ensures your project remains financially viable and aligned with organizational expectations.
Setting NPV milestones
Project managers should establish specific checkpoints for NPV reassessment. These typically coincide with major deliverables, quarterly budget reviews, or significant scope changes. By creating a framework for regular updates, the project team ensures that the financial justification for the project remains valid throughout its lifecycle.
Adjusting for actual performance
As the project moves forward, actual costs and benefits become known. These real figures must replace the initial estimates in the NPV model. If implementation costs rise or market conditions shift, the NPV will change.
Project managers use these updates to determine whether to continue, modify, or terminate the project. A project that started with a positive NPV may turn negative, requiring a decisive pivot.
Creating NPV early warning systems
A deteriorating NPV is often preceded by specific indicators, such as cost overruns, schedule delays, or reduced benefits realization. These indicators provide an opportunity for early review. A Work OS can facilitate this by using automated alerts to flag variances in budget or timeline.
These alerts act as an early warning system, prompting a re-evaluation of the NPV before the project drifts too far off course.
For organizations to maximize value, NPV must be managed at the portfolio level, not just the project level. This broad view enables strategic decision-making at scale. Portfolio-level NPV management helps leaders allocate resources efficiently and balance risk across multiple initiatives.
Portfolio NPV optimization strategies
The goal of portfolio management is to maximize the aggregate NPV of all active projects. This involves ranking projects, optimizing the timing of cash outflows, and allocating resources to the highest-value initiatives.
Optimization strategies consider constraints such as total budget limits, available talent, and the need for strategic balance between short-term wins and long-term growth.
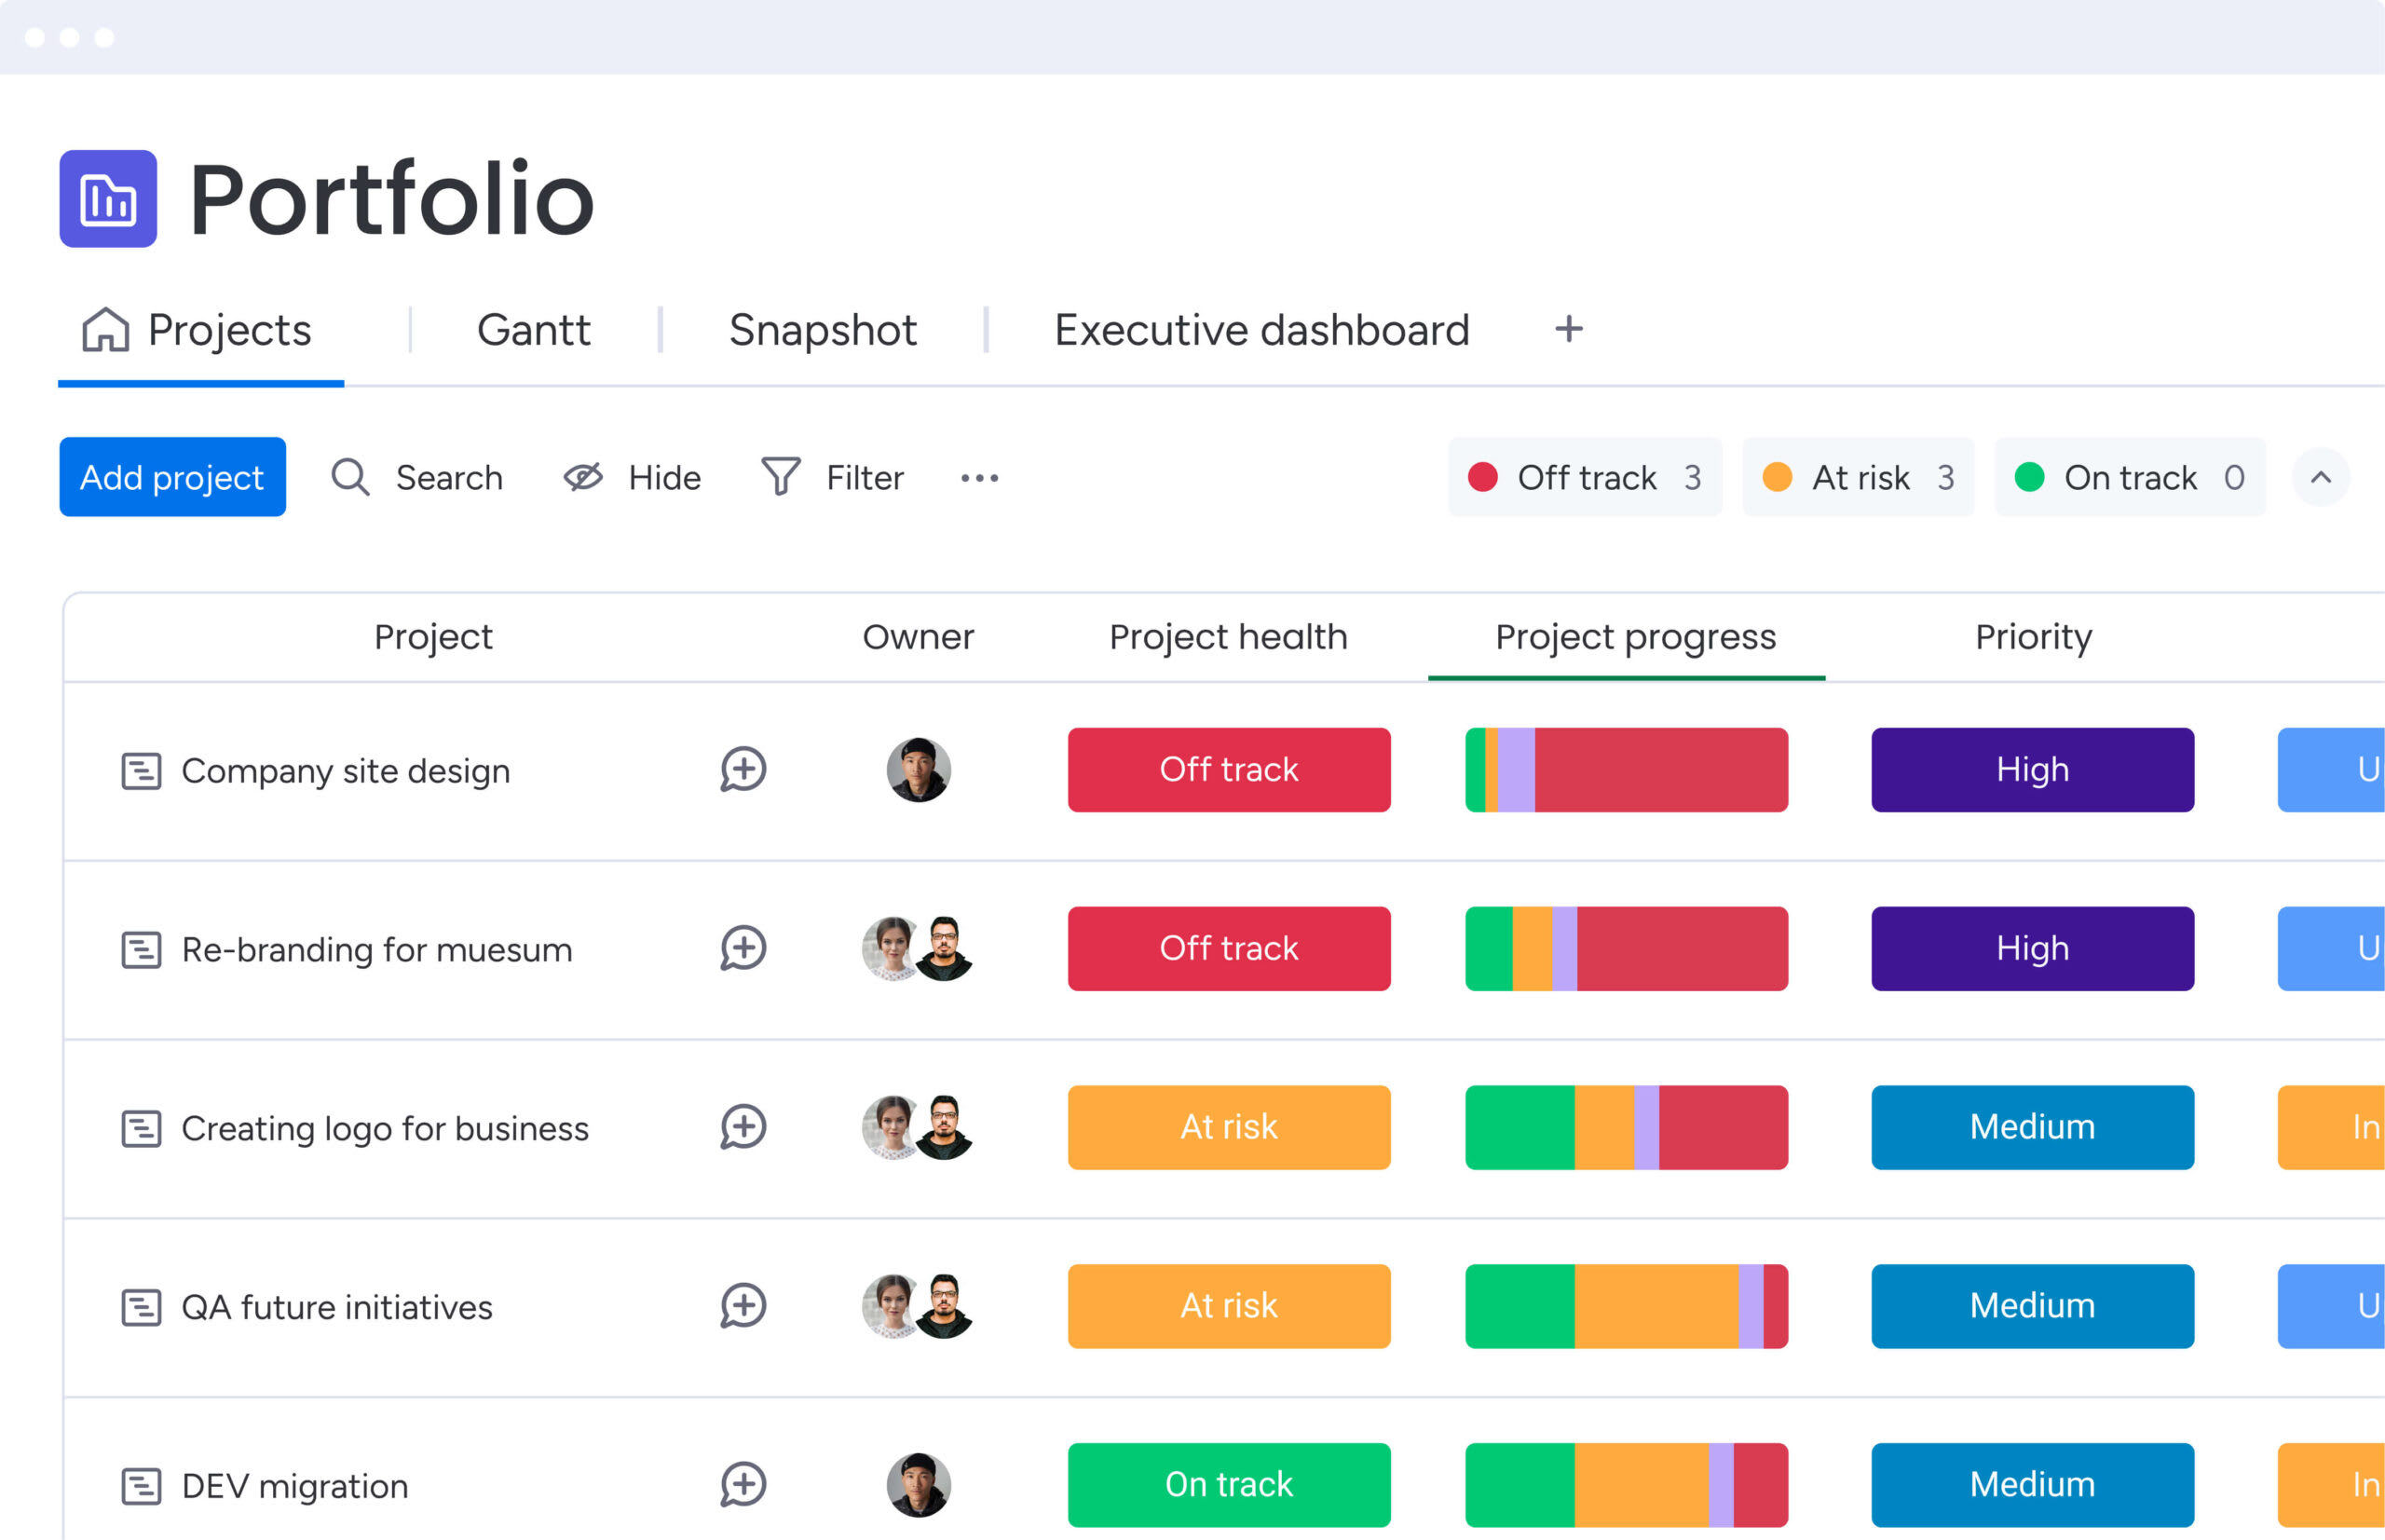
Organizations using monday work management gain visibility across all projects through portfolio dashboards, enabling data-driven trade-off decisions based on comparative NPV analysis.
Resource allocation by NPV
Resources are finite. Portfolio managers use NPV analysis to distribute capital and talent efficiently. High-NPV projects typically receive priority for critical resources. However, this allocation must also consider strategic priorities and risk tolerance.
When two high-NPV projects compete for the same specialized staff, the portfolio view helps leaders decide which project offers the superior strategic fit or time-sensitivity.
Balancing risk and return
A healthy portfolio contains a mix of projects with varying risk profiles. High-risk, high-NPV projects are balanced with lower-risk, stable-return initiatives. NPV analysis supports this diversification by quantifying the potential reward for the risk taken.
Portfolio managers monitor the total risk exposure and ensure that the collective NPV justifies the volatility. This balance protects the organization from catastrophic losses while still pursuing growth.
Portfolio managers monitor the total risk exposure and ensure that the collective NPV justifies the volatility. This balance protects the organization from catastrophic losses while still pursuing growth.

Managing NPV across a complex portfolio requires more than spreadsheets. monday work management integrates financial data directly into the project workflow, replacing static calculations with dynamic insights. The sophisticated platform transforms how teams track, analyze, and optimize NPV across their entire project portfolio.
Real-time NPV dashboards
The platform replaces static spreadsheets with dynamic dashboards that provide real-time visibility into financial performance. These dashboards automatically display live, high-level project data for insights on budget, goals, schedules, and resources.
Key capabilities include:
- Automated NPV calculations: built-in formula columns automatically update NPV figures as project data changes, eliminating manual errors.
- Visual NPV tracking: customizable charts and graphs visualize NPV trends over time, making it easy to spot deviations.
- Portfolio NPV views: leaders can aggregate NPV data across multiple projects to see the total value of the portfolio at a glance.
- Executive reporting: high-level dashboards provide executives with the summary data needed for rapid decision-making.
Automated financial tracking
Capturing accurate data is essential for reliable NPV calculations. monday work management automates the data collection process to ensure calculations remain current:
- Cash flow automation: the platform captures project costs and benefits as they occur, reducing administrative burden.
- Integration capabilities: seamless integrations with financial systems allow for the import of real-time cost data from tools you already use.
- Milestone-based updates: automations trigger NPV recalculations at key project phases, ensuring the metric is always relevant.
- Variance tracking: the system monitors actual performance against projections, highlighting discrepancies immediately.
AI-powered portfolio insights
Advanced AI capabilities within monday work management elevate NPV analysis from reactive tracking to proactive optimization. Portfolio Risk Insights scans all your project boards, quickly flagging potential issues by severity:
- Risk identification: AI analyzes project data to detect factors that could negatively impact NPV
- Resource optimization: intelligent recommendations suggest how to allocate resources to maximize portfolio-wide NPV.
- Predictive analytics: the platform forecasts future NPV performance based on current trends and historical data.
- Automated alerts: notifications inform stakeholders instantly when NPV drops below established thresholds.
Achieve sustainable growth with strategic NPV analysis
NPV analysis transforms project management from intuition-based decisions to data-driven strategy. When implemented consistently across your organization, NPV becomes the common language that connects project execution to business value. Teams gain confidence in their investment choices, executives receive the financial clarity they need, and organizations maximize returns on their project portfolios.
The key to success lies in treating NPV as a living metric rather than a one-time calculation. Regular monitoring, accurate data collection, and portfolio-level optimization ensure your projects continue delivering value throughout their lifecycle.
Organizations that master NPV analysis position themselves to make smarter investments, allocate resources more efficiently, and achieve sustainable growth through strategic project selection.
Frequently asked questions
What is a good NPV threshold for project approval?
A good NPV threshold for project approval varies by organization, but most companies set minimum NPV thresholds based on project size and risk, typically requiring NPV to exceed 10-20% of the initial investment for automatic approval.
How do you calculate NPV in Excel for projects?
To calculate NPV in Excel for projects, you use the function =NPV(discount_rate, cash_flows) and then subtract the initial investment from that result.
Can a project with negative NPV ever be justified?
Yes, projects with negative NPV are often justified for regulatory compliance, strategic positioning, or when they enable future high-NPV opportunities.
What discount rate should project managers use for NPV calculations?
Project managers should use their organization's weighted average cost of capital (typically 8-12%) plus a risk premium for uncertain projects when calculating NPV.
How frequently should NPV be recalculated during project execution?
NPV requires recalculation at major milestones, budget reviews, scope changes, or whenever actual performance significantly deviates from projections.
What is the difference between project NPV and ROI?
NPV measures the absolute dollar value a project creates, while ROI measures the percentage return on investment; both metrics provide different but complementary insights.