
Marketing KPIs in 2026 are no longer about reporting activity. They’re about proving impact.
Clicks and impressions still matter, but leadership wants to know something deeper: how marketing influences revenue, retention, and long-term growth. If your metrics cannot answer that question clearly, they are not doing their job.
At the same time, AI has raised expectations. Campaigns move faster. Optimization happens in real time. Budgets shift quickly. That means your KPI framework needs to be sharper, more focused, and directly tied to business outcomes.
In this practical guide, you’ll learn which marketing KPIs actually matter in 2026, how to calculate them correctly, how to avoid common measurement traps, and how to build a system that turns data into decisions, not just dashboards.
Key takeaways
- Marketing KPIs must connect directly to revenue and growth: Metrics such as customer acquisition cost, marketing ROI, and customer lifetime value provide clearer business impact than vanity indicators.
- Focus beats volume when selecting KPIs: Tracking five to seven carefully chosen KPIs based on business stage and objectives leads to better prioritization and faster decision-making.
- Accurate calculation is critical for credibility: Including full costs, using profit-based formulas, and avoiding attribution shortcuts ensures KPIs reflect true performance.
- AI is shifting KPI management from reporting to optimization: Predictive analytics, anomaly detection, and real-time adjustments allow teams to act before performance declines.
- Unified platforms like monday.com enable actionable measurement: Centralized data, automated dashboards, and workflow-triggered alerts help teams move from static reporting to active performance management.
What are marketing KPIs?
Marketing KPIs are quantifiable measurements that gauge marketing performance against specific strategic objectives, representing a strategic subset of broader marketing metrics.
Unlike general data points or metrics, KPIs provide a direct line of sight into business health and growth. They connect marketing activity to revenue impact, answering the question that matters: is marketing actually moving the business forward?
To see the difference between a simple data point and a true KPI, take website hits versus Customer Acquisition Cost (CAC). Total website hits tell you that traffic increased. CAC tells you whether that traffic is turning into customers at a sustainable cost and whether your growth model actually works.
Tracking these measurements helps leadership:
- Allocate resources effectively.
- Pivot strategies based on evidence rather than intuition.
- Demonstrate the value of marketing initiatives to stakeholders.
The difference between true KPIs and vanity metrics is not academic. It directly affects how confidently you can defend your budget. In fact, only 3% of CMOs can attribute more than half of their marketing spend through MROI measurement. That gap highlights how urgently teams need revenue-linked KPIs.
Metrics like social media followers or page views may look impressive in a slide deck, but they do not show whether your business model is working or whether customers are willing to pay. Real KPIs guide decisions and influence strategy. Vanity metrics simply make activity visible.
A focus on KPIs ensures that marketing teams prioritize outcomes contributing to the bottom line, such as:
- Lead quality.
- Conversion efficiency.
- Customer retention.

Marketing KPIs vs marketing metrics
While all KPIs are metrics, not all metrics are KPIs. Understanding this key difference helps teams avoid drowning in data without knowing what to do next.
Metrics measure the status of specific processes, while KPIs measure progress toward critical business goals. Metrics show what happened. KPIs show why it matters and what to do about it.
The table below illustrates how the same marketing function can be measured at both operational and strategic levels:
| Context | Metric (operational monitoring) | KPI (strategic decision-making) |
|---|---|---|
| Website traffic | Total page views per month | Percentage growth in qualified traffic |
| Email marketing | Open rate and click-through rate | Revenue generated per subscriber |
| Social media | Total likes and shares | Lead conversion rate from social channels |
| Content marketing | Average time on page | Marketing Qualified Leads (MQLs) generated |
| Paid advertising | Cost Per Click (CPC) | Return on Ad Spend (ROAS) |
Metrics like social media followers or page views may look impressive in a slide deck, but they do not show whether your business model is working or whether customers are willing to pay.
Types of marketing KPIs
Marketing covers a lot of ground, so you need different types of measurements to see the full performance picture. These categories below align with specific business objectives and marketing disciplines, providing a framework for comprehensive measurement.
Here’s what each category tells you about marketing effectiveness:
- Customer acquisition KPIs: Measure the efficiency and effectiveness of attracting new business. They focus on the cost and speed of converting strangers into prospects and customers. Examples include cost per lead (CPL) and customer acquisition cost (CAC).
- Revenue performance KPIs: Track the direct financial return on marketing investment, connecting activities to the bottom line. They are essential for budget justification. Examples include return on ad spend (ROAS) and customer lifetime value (CLV).
- Digital marketing KPIs: Cover online channel performance and the effectiveness of digital campaigns across web and mobile. They indicate technical and user experience health. Examples include conversion rate and bounce rate.
- Content performance KPIs: Track how well content engages audiences and drives them toward profitable action. They measure relevance and authority. Examples include time on page and content download rate.
- Email marketing KPIs: Measure the health of the subscriber database and the effectiveness of direct communication. They indicate audience retention and interest. Examples include list growth Rate and unsubscribe rate.
- Social media KPIs: Evaluate performance on social platforms and the depth of community engagement. They measure brand resonance and reach. Examples include engagement rate and social share of voice.
- Brand health KPIs: Assess brand perception, awareness, and market position relative to competitors. They track intangible assets that drive long-term growth. Examples include brand awareness and net promoter score (NPS).
- Marketing operations KPIs: Track internal marketing efficiency, process effectiveness, and team productivity. They measure how well the marketing machine is running. Examples include campaign cycle time and marketing budget utilization.
How to choose marketing KPIs for your business
Choosing the right marketing KPIs starts with clarity, not spreadsheets.
Before you look at dashboards or reports, step back and ask what the business is trying to achieve this year. Growth-stage companies often prioritize acquisition metrics like lead volume and Customer Acquisition Cost. More established organizations typically focus on retention, expansion, and efficiency, tracking metrics like Customer Lifetime Value and churn rate.
Your KPIs should reflect your current priorities, not just the data that happens to be easiest to measure.
Mapping KPIs to the customer journey
KPIs should correspond to different stages of the customer funnel. This way, you’re measuring the full customer experience, not just random interactions.
Each stage needs different focus areas:
- Awareness: Focus on brand recall and reach.
- Consideration: Track website traffic and engagement rates.
- Conversion: Prioritize conversion rate and cost per acquisition.
- Retention: Monitor churn rate and customer satisfaction scores.
Industry considerations
The same business goal needs different KPIs depending on your industry. A SaaS company will track Monthly Recurring Revenue (MRR) and Churn, while an e-commerce business will focus on Average Order Value (AOV) and Cart Abandonment Rate. B2B service firms may prioritize Lead-to-Close Velocity and Pipeline Value.
Common selection mistakes
Teams often fail by tracking too many KPIs and losing focus. Other mistakes to avoid:
- Focusing only on positive metrics: Ignoring warning signs like high churn.
- Selecting uncontrollable KPIs: Choosing metrics that marketing teams can’t control creates frustration and makes it impossible to hold anyone accountable.
Ask yourself three questions:
- Is this metric measurable?
- Is it actionable?
- Does it directly tie to a revenue or strategic goal?
Essential marketing KPIs to track in 2026
Not all marketing KPIs carry equal weight.
The metrics below represent the indicators that consistently connect marketing activity to revenue, efficiency, and long-term growth. Together, they give you visibility across the full performance picture, from acquisition and conversion to engagement, retention, and operational effectiveness.
If you track these consistently and interpret them correctly, you move from reporting activity to managing impact.
Customer acquisition and revenue
- Customer Acquisition Cost (CAC): The total cost of sales and marketing efforts needed to acquire a new customer. It determines the profitability of scaling efforts.
- Marketing ROI: The profit generated by marketing efforts relative to the cost of those efforts. It justifies marketing spend to the C-suite.
- Customer lifetime value (CLV): The total revenue a business can expect from a single customer account. It helps determine how much can be spent on acquisition.
- Sales revenue: Revenue generated directly from marketing campaigns. It is the ultimate measure of marketing effectiveness.
Lead generation and conversion
- Marketing qualified leads (MQLs): Leads that have indicated interest and fit the target profile. This measures the quality of the top-of-funnel intake.
- Sales qualified leads (SQLs): MQLs that sales teams have accepted as ready for direct engagement. This measures alignment between marketing and sales.
- Lead-to-customer conversion rate: The percentage of leads that become paying customers. It indicates the efficiency of the entire sales funnel.
- Cost Per Lead (CPL): The amount spent to acquire a single lead. It helps optimize budget allocation across channels.
Digital and content
- Organic traffic: Visitors arriving via search engines without paid promotion. It measures the long-term value of SEO and content efforts.
- Bounce rate: The percentage of visitors who leave after viewing only one page. It indicates relevance and user experience quality.
- Click-through rate (CTR): The ratio of users who click on a specific link to the number of total users who view a page, email, or advertisement.
- Time on page: The average amount of time a user spends on a specific page. It indicates content engagement and quality.
Email and social
- Email open rate: The percentage of recipients who open a specific email. It measures subject line effectiveness and audience interest.
- Unsubscribe rate: The percentage of users who opt out of a mailing list. It serves as a warning signal for content relevance or frequency issues.
- Engagement rate: The level of interaction (likes, comments, shares) relative to audience size. It measures community health.
- Social share of voice: The brand’s presence in the market compared to competitors. It measures brand dominance in conversations.
Brand and operations
- Net promoter score (NPS): A metric used to gauge customer loyalty and satisfaction. It predicts business growth and retention.
- Brand awareness: The extent to which consumers are familiar with the distinct qualities or image of a particular brand.
- Churn rate: The percentage of customers who stop doing business with an entity. It is the inverse of retention and critical for subscription models.
- Customer retention rate: The percentage of customers a company keeps over a given period. It costs less to retain customers than to acquire new ones.
- Return on Ad spend (ROAS): Revenue generated for every dollar spent on advertising. It measures the gross effectiveness of paid campaigns.
- Cost per acquisition (CPA): The aggregate cost to acquire one paying customer on a specific campaign or channel.
- Funnel drop-off rate: The percentage of potential customers who leave the sales funnel at a specific stage. It identifies bottlenecks in the journey.
- Marketing cycle time: The time it takes to go from idea to campaign launch. It measures operational agility.
- Budget utilization: The percentage of the marketing budget that has been spent. It ensures resources are being deployed as planned.
Learn more: How to build a brand awareness strategy that drives recognition
How to calculate marketing KPIs
Knowing the math behind each metric helps you interpret it correctly and avoid costly mistakes. Platforms like monday.com can automate these calculations through dashboards and formula columns, but it’s still really helpful to know the formulas for manual checks and deeper analysis.
Customer Acquisition Cost (CAC)
Formula: (total sales + marketing expenses) / number of new customers acquired.
Example: ($50,000 sales spend + $30,000 marketing spend) / 1,000 new customers = $80 CAC.
Key insights:
- A lower CAC indicates higher efficiency.
- It should always be significantly lower than CLV.
Common mistake:
Failing to include overhead, salaries, and platform costs in the expense calculation.
Return on Investment (Marketing ROI)
Formula: ((sales growth – marketing cost) / marketing cost) x 100.
Example: (($150,000 revenue – $30,000 cost) / $30,000 cost) x 100 = 400% ROI.
Key insights:
- A 5:1 ratio (500%) is typically considered strong for most industries.
Common mistake:
Using gross revenue instead of profit or sales growth directly attributable to marketing.
Conversion rate
Formula: (number of conversions / total number of visitors) × 100.
Example: (500 sales / 20,000 website visitors) × 100 = 2.5% conversion rate.
Key insights:
- Higher rates indicate stronger targeting and user experience.
Common mistake:
Calculating based on total sessions rather than unique visitors can skew data.
Customer Lifetime Value (CLV)
Formula: (average purchase value × average purchase frequency) × average customer lifespan.
Example: ($100 per order × 4 orders per year) × 3 years = $1,200 CLV.
Key insights:
- This figure dictates the ceiling for CAC; you cannot spend more to acquire a customer than they are worth
Common mistake:
Using revenue instead of gross margin contribution
Churn rate
Formula: (customers lost during period / total customers at start of period) × 100.
Example: (50 lost customers / 1,000 starting customers) × 100 = 5% churn rate.
Key insights:
- High churn indicates product dissatisfaction or poor customer service
Common mistake:
Excluding new customers gained during the period from the denominator calculation
AI-powered marketing performance management
AI is shifting marketing KPI management from static, backward-looking reports to forward-looking optimization. Instead of analyzing performance after results are finalized, teams can anticipate outcomes and adjust strategy in real time. This shift moves KPI management from reporting into active performance control.
Rather than focusing only on automation, AI supports prediction, prioritization, and continuous improvement. Organizations that adopt AI-driven KPI management gain earlier visibility into risk and opportunity, enabling faster and more confident decision-making across marketing operations.
AI capabilities that influence marketing measurement include predictive analytics, automated anomaly detection, insight generation, and real-time optimization. Each capability addresses a specific KPI management challenge, as outlined below.
- Predictive analytics: AI forecasts future KPI trends based on historical data, seasonality, and market signals. This allows teams to anticipate dips in conversion or spikes in churn and adjust budgets before performance suffers.
- Automated anomaly detection: Algorithms monitor data streams continuously to flag unusual patterns. Whether it’s a broken checkout link causing a drop in conversions or a viral post driving a spike in traffic, AI alerts teams instantly, enabling rapid response.
- AI-driven insights: AI identifies hidden correlations that human analysis might miss. AI might reveal that leads generated from a specific content topic have higher retention rates, prompting a strategic shift in content production.
- Real-time optimization: AI adjusts live campaigns based on KPI performance. If a specific ad variation hits a high CPA threshold, the system can automatically pause it and reallocate budget to higher-performing creatives.
Organizations that adopt AI-driven KPI management gain earlier visibility into risk and opportunity, enabling faster and more confident decision-making across marketing operations.
How to build marketing dashboards that drive action
A dashboard is a communication tool, not just a data dump. Effective marketing dashboards prioritize visual hierarchy and data storytelling to turn raw numbers into insights you can act on. Good dashboard design uses visual hierarchy and data storytelling to turn raw numbers into insights you can act on. The goal is to make it easy for stakeholders to understand performance at a glance.
Role-based views
Different stakeholders need different views. Here are some tailored approaches:
- Executive dashboard: Focus on high-level ROI, revenue growth, and budget utilization.
- Marketing manager’s view: Drill down into channel performance and campaign status.
- Specialist dashboard: Granular views of ad sets, keywords, and creative performance.
Data integration and automation
Dashboards must pull data from multiple sources, including CRM, social platforms, email platforms, and ad networks, into a unified view. This ensures all data is automatically updated and consistently current.
Dashboards should do more than visualize data, they should drive action. When a KPI hits a specific threshold (such as CPL exceeding $50), the dashboard can trigger an automated workflow to notify the campaign manager or pause the spend.
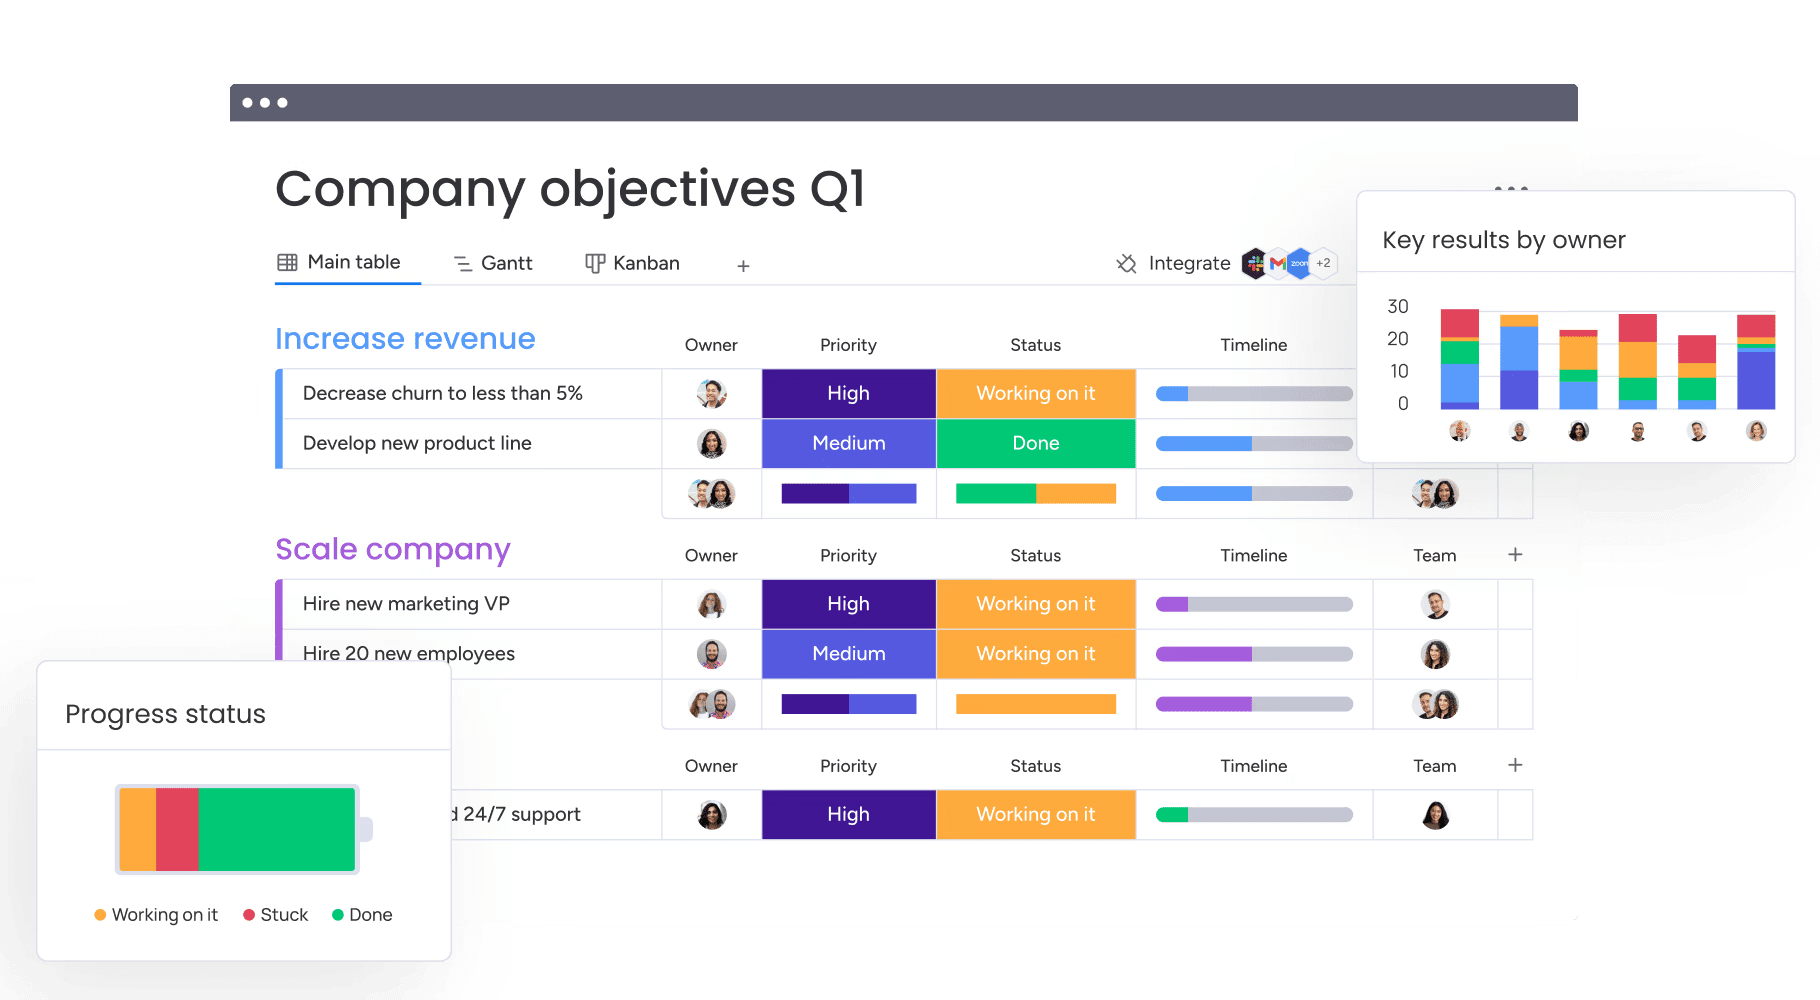
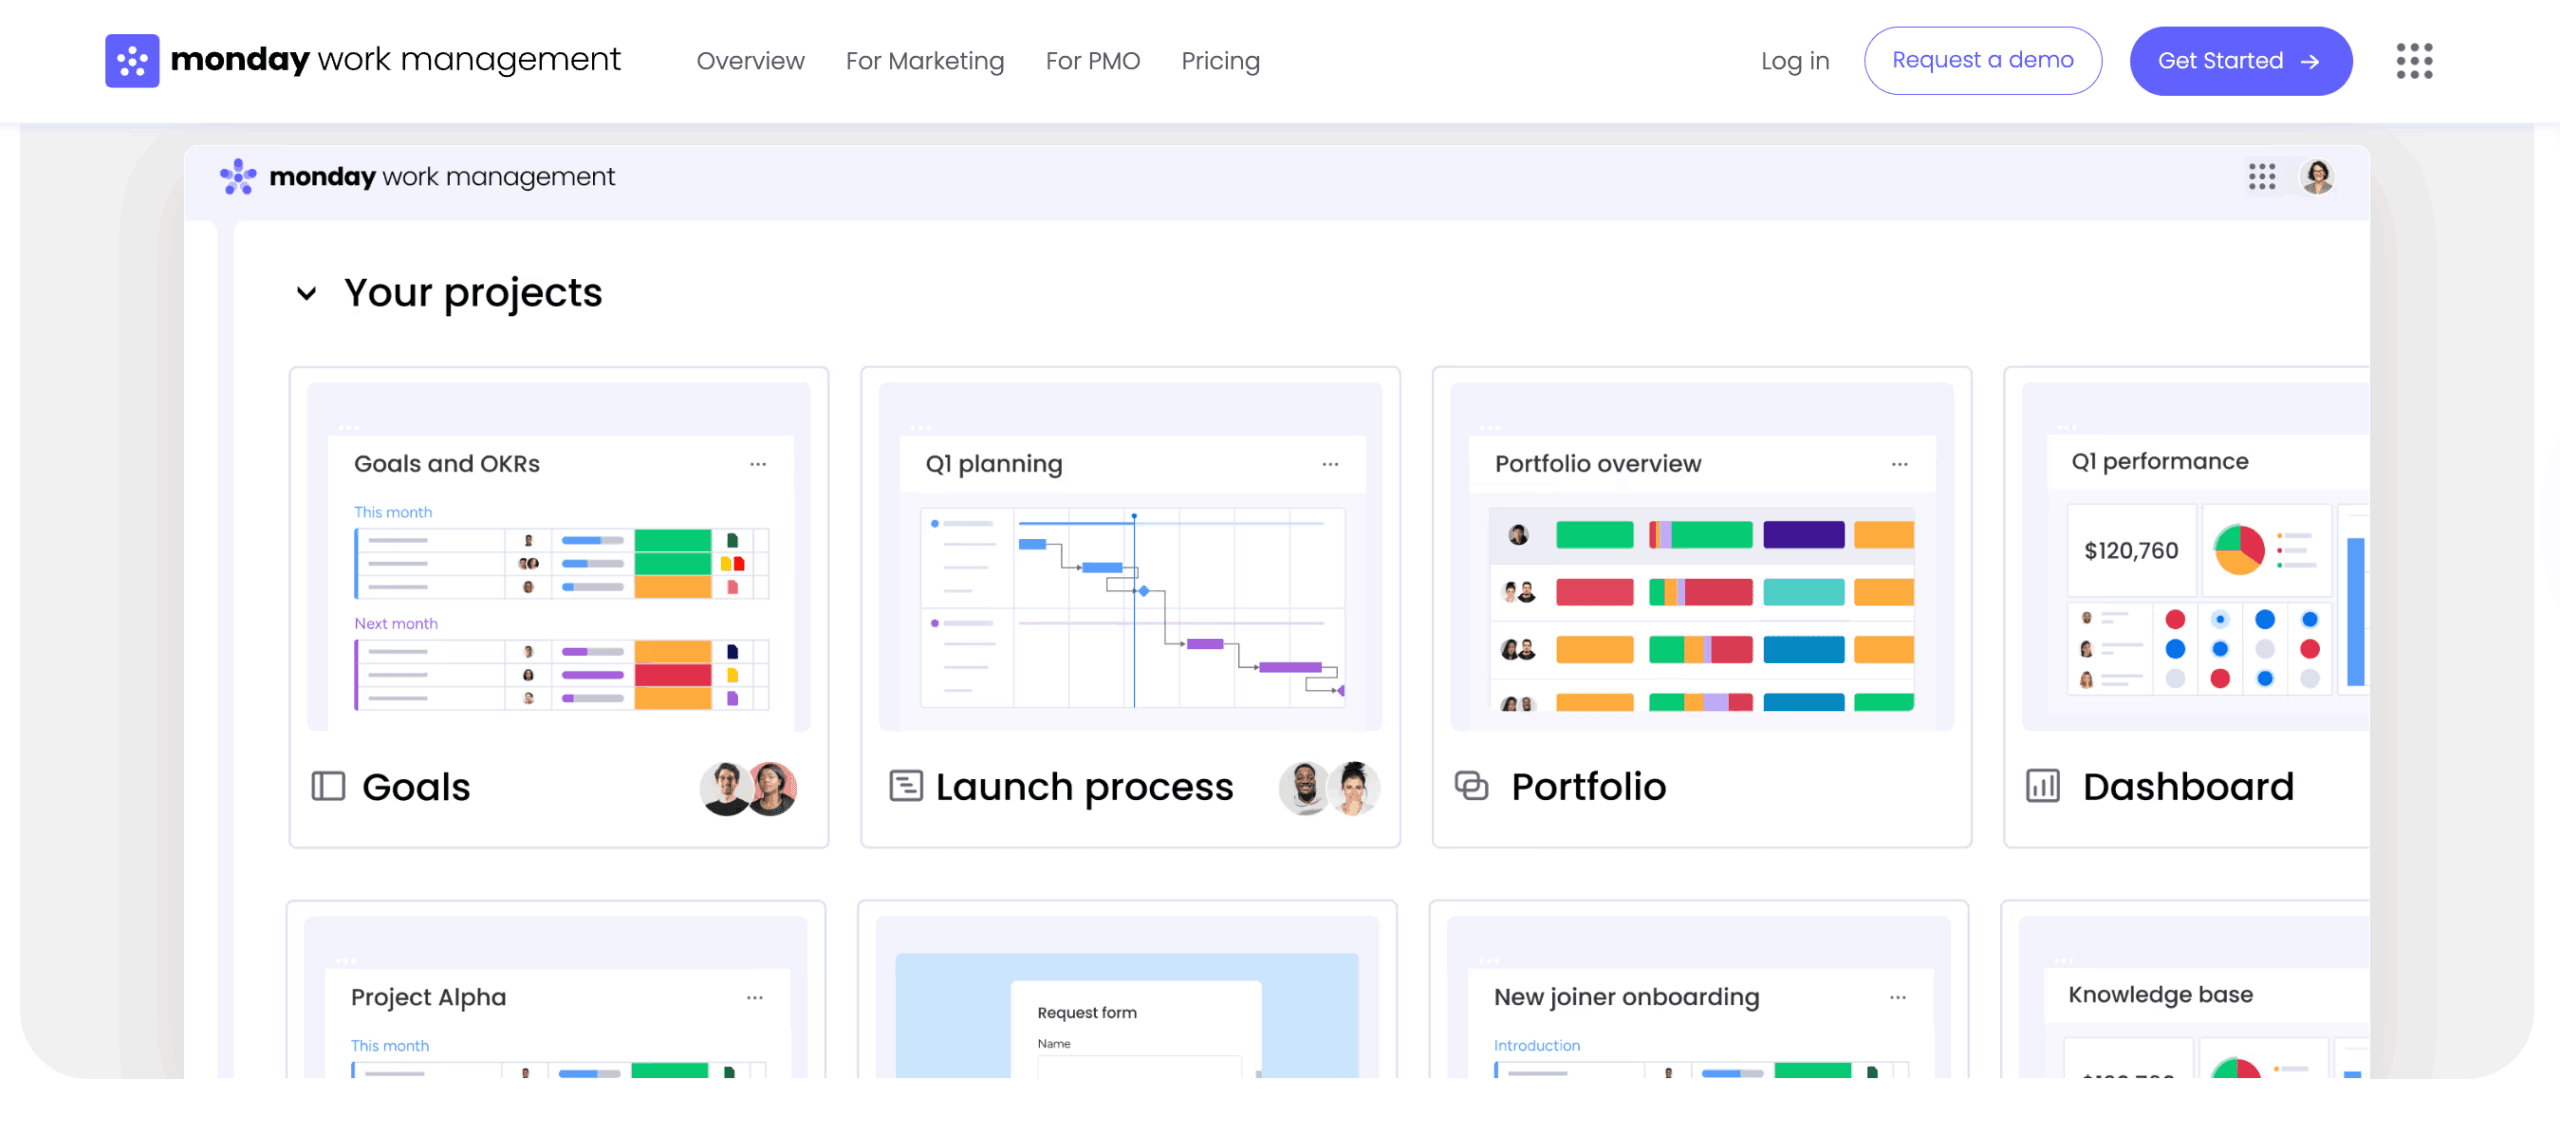
Teams using monday.com can build dashboards with over ten drag-and-drop widgets, automatically displaying live high-level project data for insights on budget, goals, schedules, and resources, or start with a proven KPI template for faster implementation.
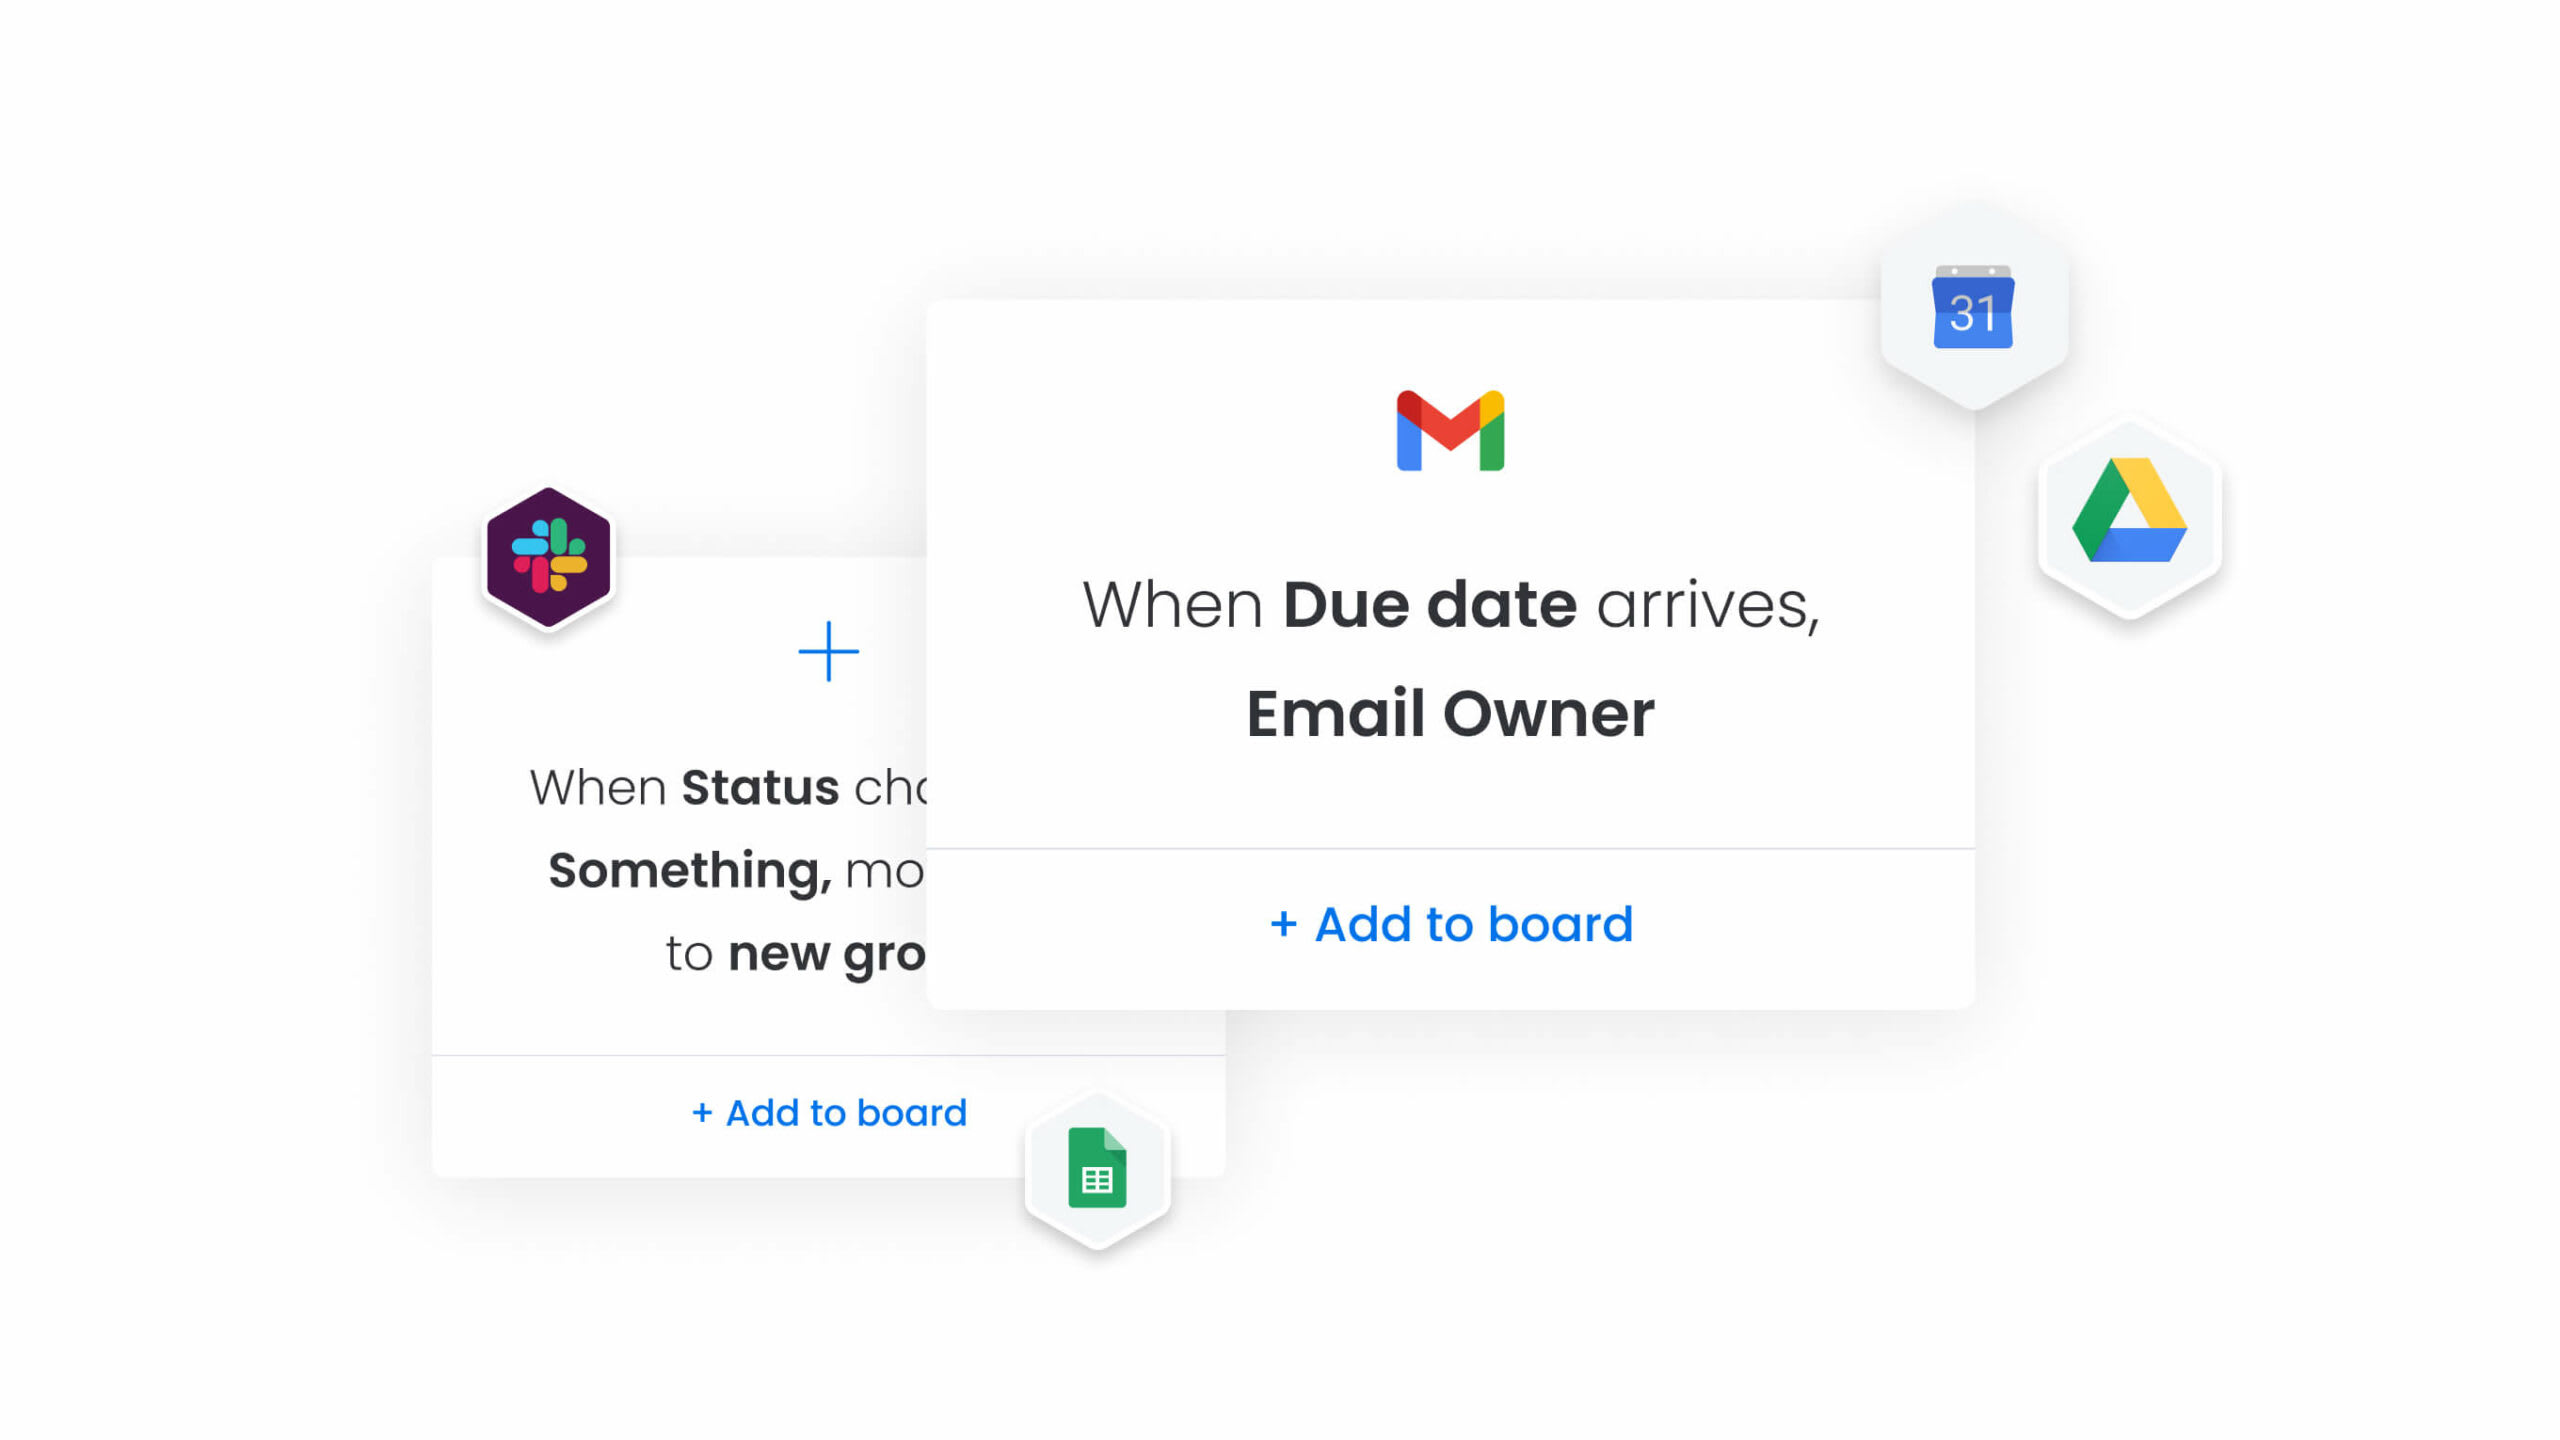
The platform’s automations can also trigger notifications and status updates based on KPI thresholds, turning static measurement into active management.
Effective layouts
Here are dashboard layouts for different organizational needs:
- Strategic layout: High-level cards for revenue and ROI at the top, followed by trend lines for monthly growth.
- Operational layout: Funnel visualization showing conversion rates between stages, with tables for active campaign performance.
- Tactical layout: Real-time gauges for daily ad spend and lead volume.
5 common marketing KPI challenges and solutions
Marketing teams hit the same roadblocks when setting up KPI tracking systems. Understanding these challenges and their solutions helps you avoid common pitfalls and become more proficient at measurement faster.
Breaking down data silos
Challenge: Marketing data often lives in disconnected platforms: Google Analytics, Salesforce, HubSpot, and social platforms. This creates incomplete KPI pictures and makes attribution impossible.
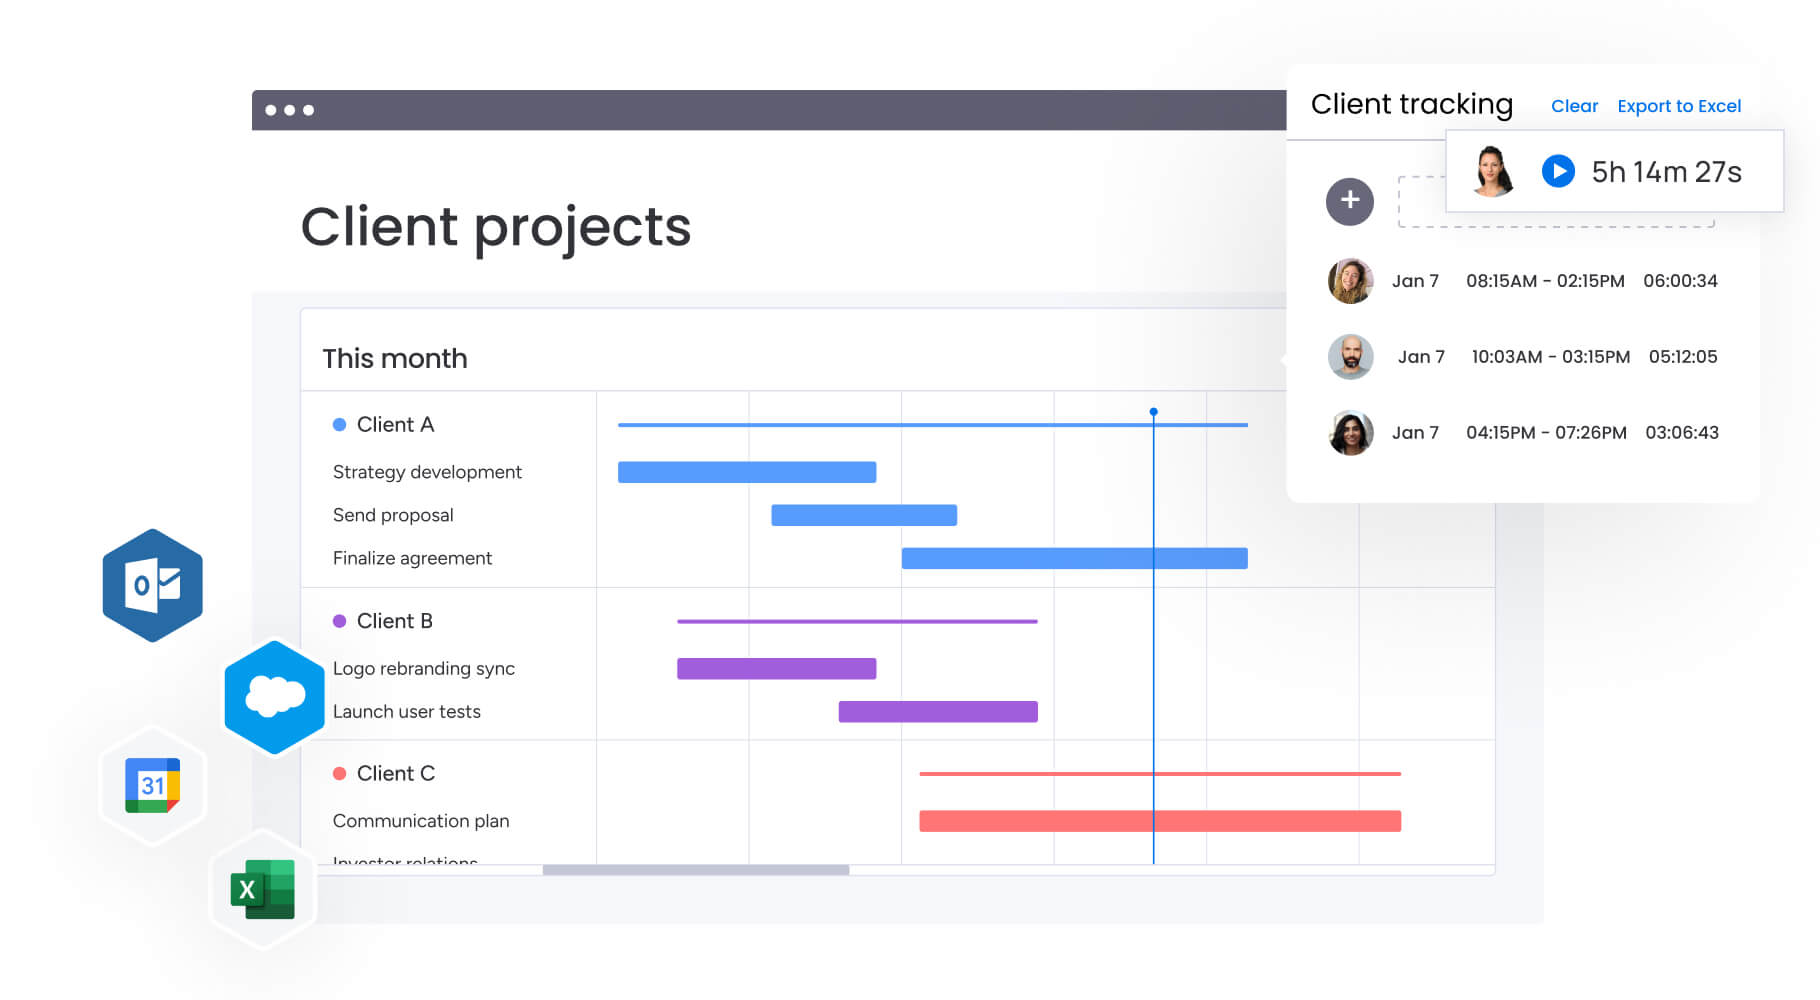
Solution: Use a work management platform that integrates with these tools and centralizes your data. monday.com connects with over 200 apps, including Microsoft Teams, Gmail, Slack, Jira, and Salesforce, creating a single source of truth where data from all channels converges.
Aligning marketing and finance KPIs
Challenge: Marketing speaks in leads and clicks; finance speaks in revenue and margin. This disconnect leads to budget cuts when marketing can’t prove its value.
Solution: Create a shared data dictionary and automate your reporting. Marketing reports should translate operational metrics into financial impact (such as Pipeline Value instead of just Lead Volume). Dashboards that display both marketing and financial KPIs in one view bridge this communication gap.
Eliminating manual reporting
Challenge: Spreadsheet-based reporting introduces errors and consumes time that could be spent on strategic analysis.
Solution: Automate data collection and visualization so dashboards update continuously and reflect the most current information.
Proving marketing attribution
Challenge: Customer journeys aren’t straight lines, they involve multiple touchpoints. Giving all the credit to the last click ignores how much awareness campaigns contribute.
Solution: Use multi-touch attribution models that give credit to every interaction in the customer journey. This shows you more accurately which channels contribute to the final sale.
Achieving real-time visibility
Challenge: Waiting for end-of-month reports means you’re reacting to problems weeks too late.
Solution: Switch to live dashboards that give you instant visibility. This lets teams adjust tactics mid-campaign instead of analyzing what went wrong after the budget’s gone.
Aligning marketing KPIs with business goals
Marketing metrics must connect to business outcomes if you want executive buy-in. C-suite leaders care about revenue, growth, and market share, not open rates and impressions. To close this gap, marketing teams must connect their operational KPIs directly to these high-level goals.
Learn more: Marketing goals
Revenue and growth connection
Using attribution models, marketers can demonstrate how specific campaigns contributed to pipeline generation and closed deals. Reporting should focus on “revenue influenced by marketing” and “marketing originated revenue” rather than just lead counts. This makes marketing look like a profit driver, not just an expense.
Cross-functional alignment
Marketing KPIs should align with sales and customer success metrics. Tracking MQL-to-SQL conversion rates ensures lead quality supports sales outcomes, while shared user retention metrics improve long-term customer value.
With monday.com, workflows can connect marketing activities to sales pipelines and customer success data. Portfolio-level views enable leadership to monitor performance across programs and identify issues early.
Storytelling with data
Executive reporting should communicate cause and effect. Framing insights around actions taken, results achieved, and projected impact improves clarity and credibility.
Transform marketing KPIs with monday.com
monday.com brings scattered marketing functions into one place, solving data silos, manual reporting, and alignment issues. By centralizing KPI tracking across all marketing activities, the platform gives you one reliable source that keeps teams focused on impact.
The platform connects with over 200 apps and automatically pulls data from ad networks, CRMs, and email platforms. No more manual data entry, and everyone sees the same numbers.
| Capability | Traditional approach | monday work management |
|---|---|---|
| Data integration | Manual exports from multiple platforms | Automated data sync across 200+ integrations |
| KPI calculation | Spreadsheet formulas and manual updates | Automated workflows with real-time calculations |
| Reporting | Static reports created manually | Dynamic dashboards with live data |
| Collaboration | Email updates and meeting reviews | Centralized workspace with automated notifications |
| Insights generation | Manual analysis and interpretation | AI-powered pattern recognition and recommendations |
Unified marketing performance
Automations turn static data into actions. Teams can build workflows that calculate KPIs automatically, send alerts when metrics hit thresholds, or update project statuses based on performance. If a campaign’s ROI drops below a set target, the system can instantly notify the strategy team.
AI-enhanced optimization
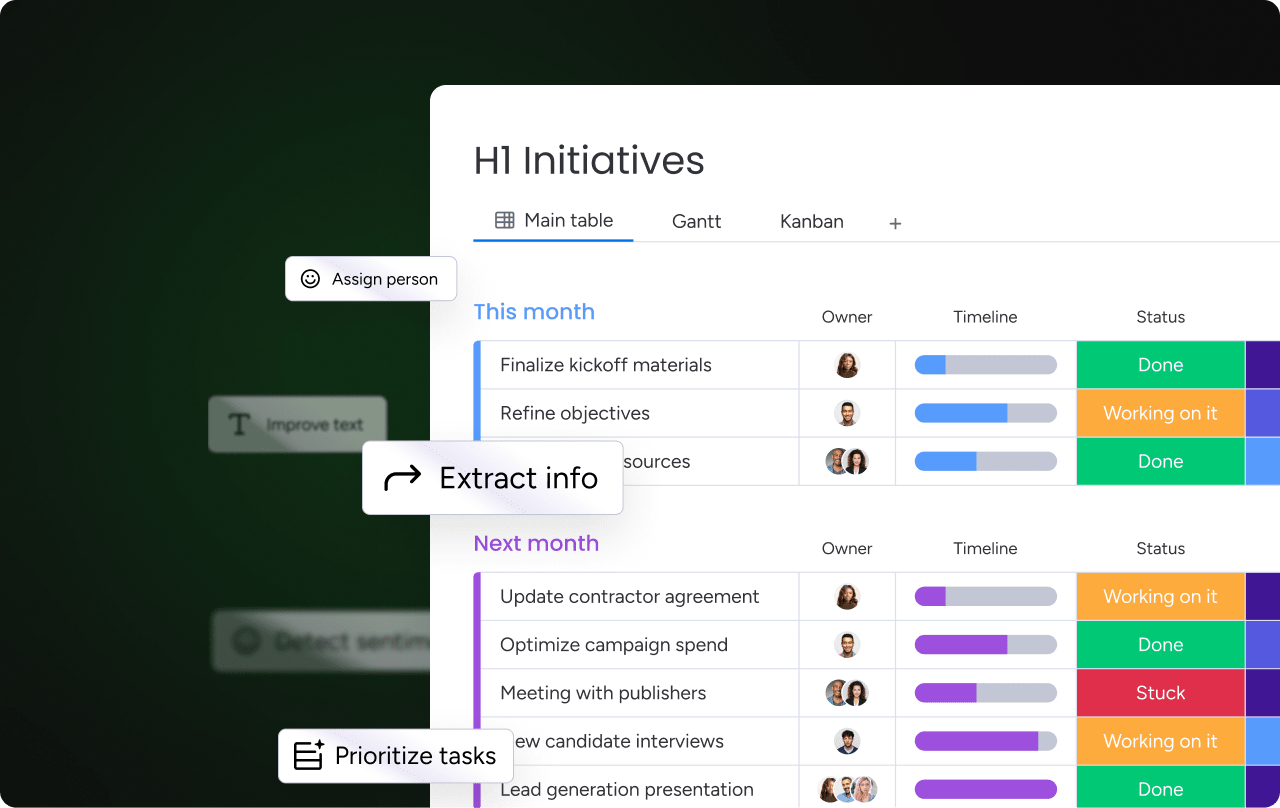
monday AI Blocks such as Categorize and Extract Info process unstructured data, while Digital Workers support performance analysis. These capabilities reduce manual effort and accelerate insight generation.
By combining automation, AI-driven insights, and centralized dashboards, teams can shift from manual reporting to strategic performance management.
“monday.com has been a life-changer. It gives us transparency, accountability, and a centralized place to manage projects across the globe".
Kendra Seier | Project Manager“monday.com is the link that holds our business together — connecting our support office and stores with the visibility to move fast, stay consistent, and understand the impact on revenue.”
Duncan McHugh | Chief Operations OfficerDrive marketing success through strategic KPI management
Modern marketing teams face increasing pressure to prove impact while managing fragmented data, manual reporting, and constant performance optimization. As KPIs become more closely tied to revenue, efficiency, and long-term growth, teams need systems that connect daily execution to strategic outcomes without adding operational complexity.
monday.com supports this shift by bringing KPI tracking, workflows, and collaboration into a single, unified environment:
- Centralized KPI visibility: Connects data from marketing, sales, and finance into shared dashboards that align teams around revenue-driven outcomes.
- Automated reporting and calculations: Reduces manual effort by updating KPIs in real time and eliminating spreadsheet-based reporting errors.
- Workflow-driven performance management: Triggers alerts, status changes, or actions when KPIs cross defined thresholds.
- AI-supported insights and optimization: Helps identify patterns, risks, and opportunities earlier through predictive analysis and anomaly detection.
- Scalable structure for growing teams: Supports consistent measurement as campaigns, channels, and stakeholders expand.
By linking execution-level work to measurable business results, the intelligent platform enables marketing teams to operate with greater efficiency, stronger alignment, and clearer strategic impact, without increasing complexity or administrative overhead.
Frequently asked questions
What are the five most important marketing KPIs for beginners?
The five most important marketing KPIs for beginners are Customer Acquisition Cost (CAC), Conversion Rate, Marketing ROI, Lead Generation Rate, and Customer Lifetime Value (CLV), as these metrics connect marketing activities directly to business outcomes.
How do marketing KPIs differ from marketing metrics?
Marketing KPIs differ from marketing metrics in that KPIs are strategic measurements tied to specific business objectives that drive decision-making, while metrics are broader measurements that track operational status but may not directly connect to business goals.
What marketing KPIs should marketing managers track daily?
Marketing managers should track Conversion Rates, Cost Per Lead (CPL), campaign performance metrics, and lead quality indicators daily, as these require immediate optimization decisions to prevent budget wastage.
How often should marketing KPIs be reviewed and updated?
Marketing KPIs should be reviewed weekly for tactical adjustments, with monthly strategic reviews and quarterly assessments to ensure the KPIs remain relevant to evolving business objectives.
What are examples of digital marketing KPIs that matter most?
The digital marketing KPIs that matter most include Click-Through Rates (CTR), Cost Per Acquisition (CPA), Return on Ad Spend (ROAS), organic search rankings, and email engagement rates, as these measure digital channel effectiveness.
How do you align marketing KPIs with overall business objectives?
To align marketing KPIs with overall business objectives, start with business goals like revenue growth or market expansion, then select KPIs that measure marketing's contribution to those specific outcomes rather than tracking generic marketing activities.