


Most teams can tell you what they’re working on, but struggle to understand how long the work takes. This lack of knowledge creates opaque timelines, hidden delays, and delivery dates built on guesswork. Cycle time closes it by measuring the active time a task spends in progress, from the moment work starts to the moment it’s done and you can check it off your list.
Once you know how to calculate cycle time, you can forecast realistic delivery dates, pinpoint the stages where work stalls, and streamline the handoffs that drain hours. This guide explores cycle time in more detail, including a calculation formula you can borrow and how cycle time compares to lead time and takt time.
Key takeaways
- Cycle time is the total active time a task takes from the moment work starts until it’s complete, including waits inside the active work phase.
- The core formula is cycle time equals net production time divided by the number of units produced.
- Cycle time measures active work, lead time measures the full wait from request to delivery, and takt time sets the pace needed to meet demand.
- The biggest lever for reducing cycle time is limiting work in progress so tasks finish before new ones start.
- monday AI Workspace captures cycle time automatically with the Time Tracking column, formula columns, and Automations, then highlights bottlenecks in Dashboards.
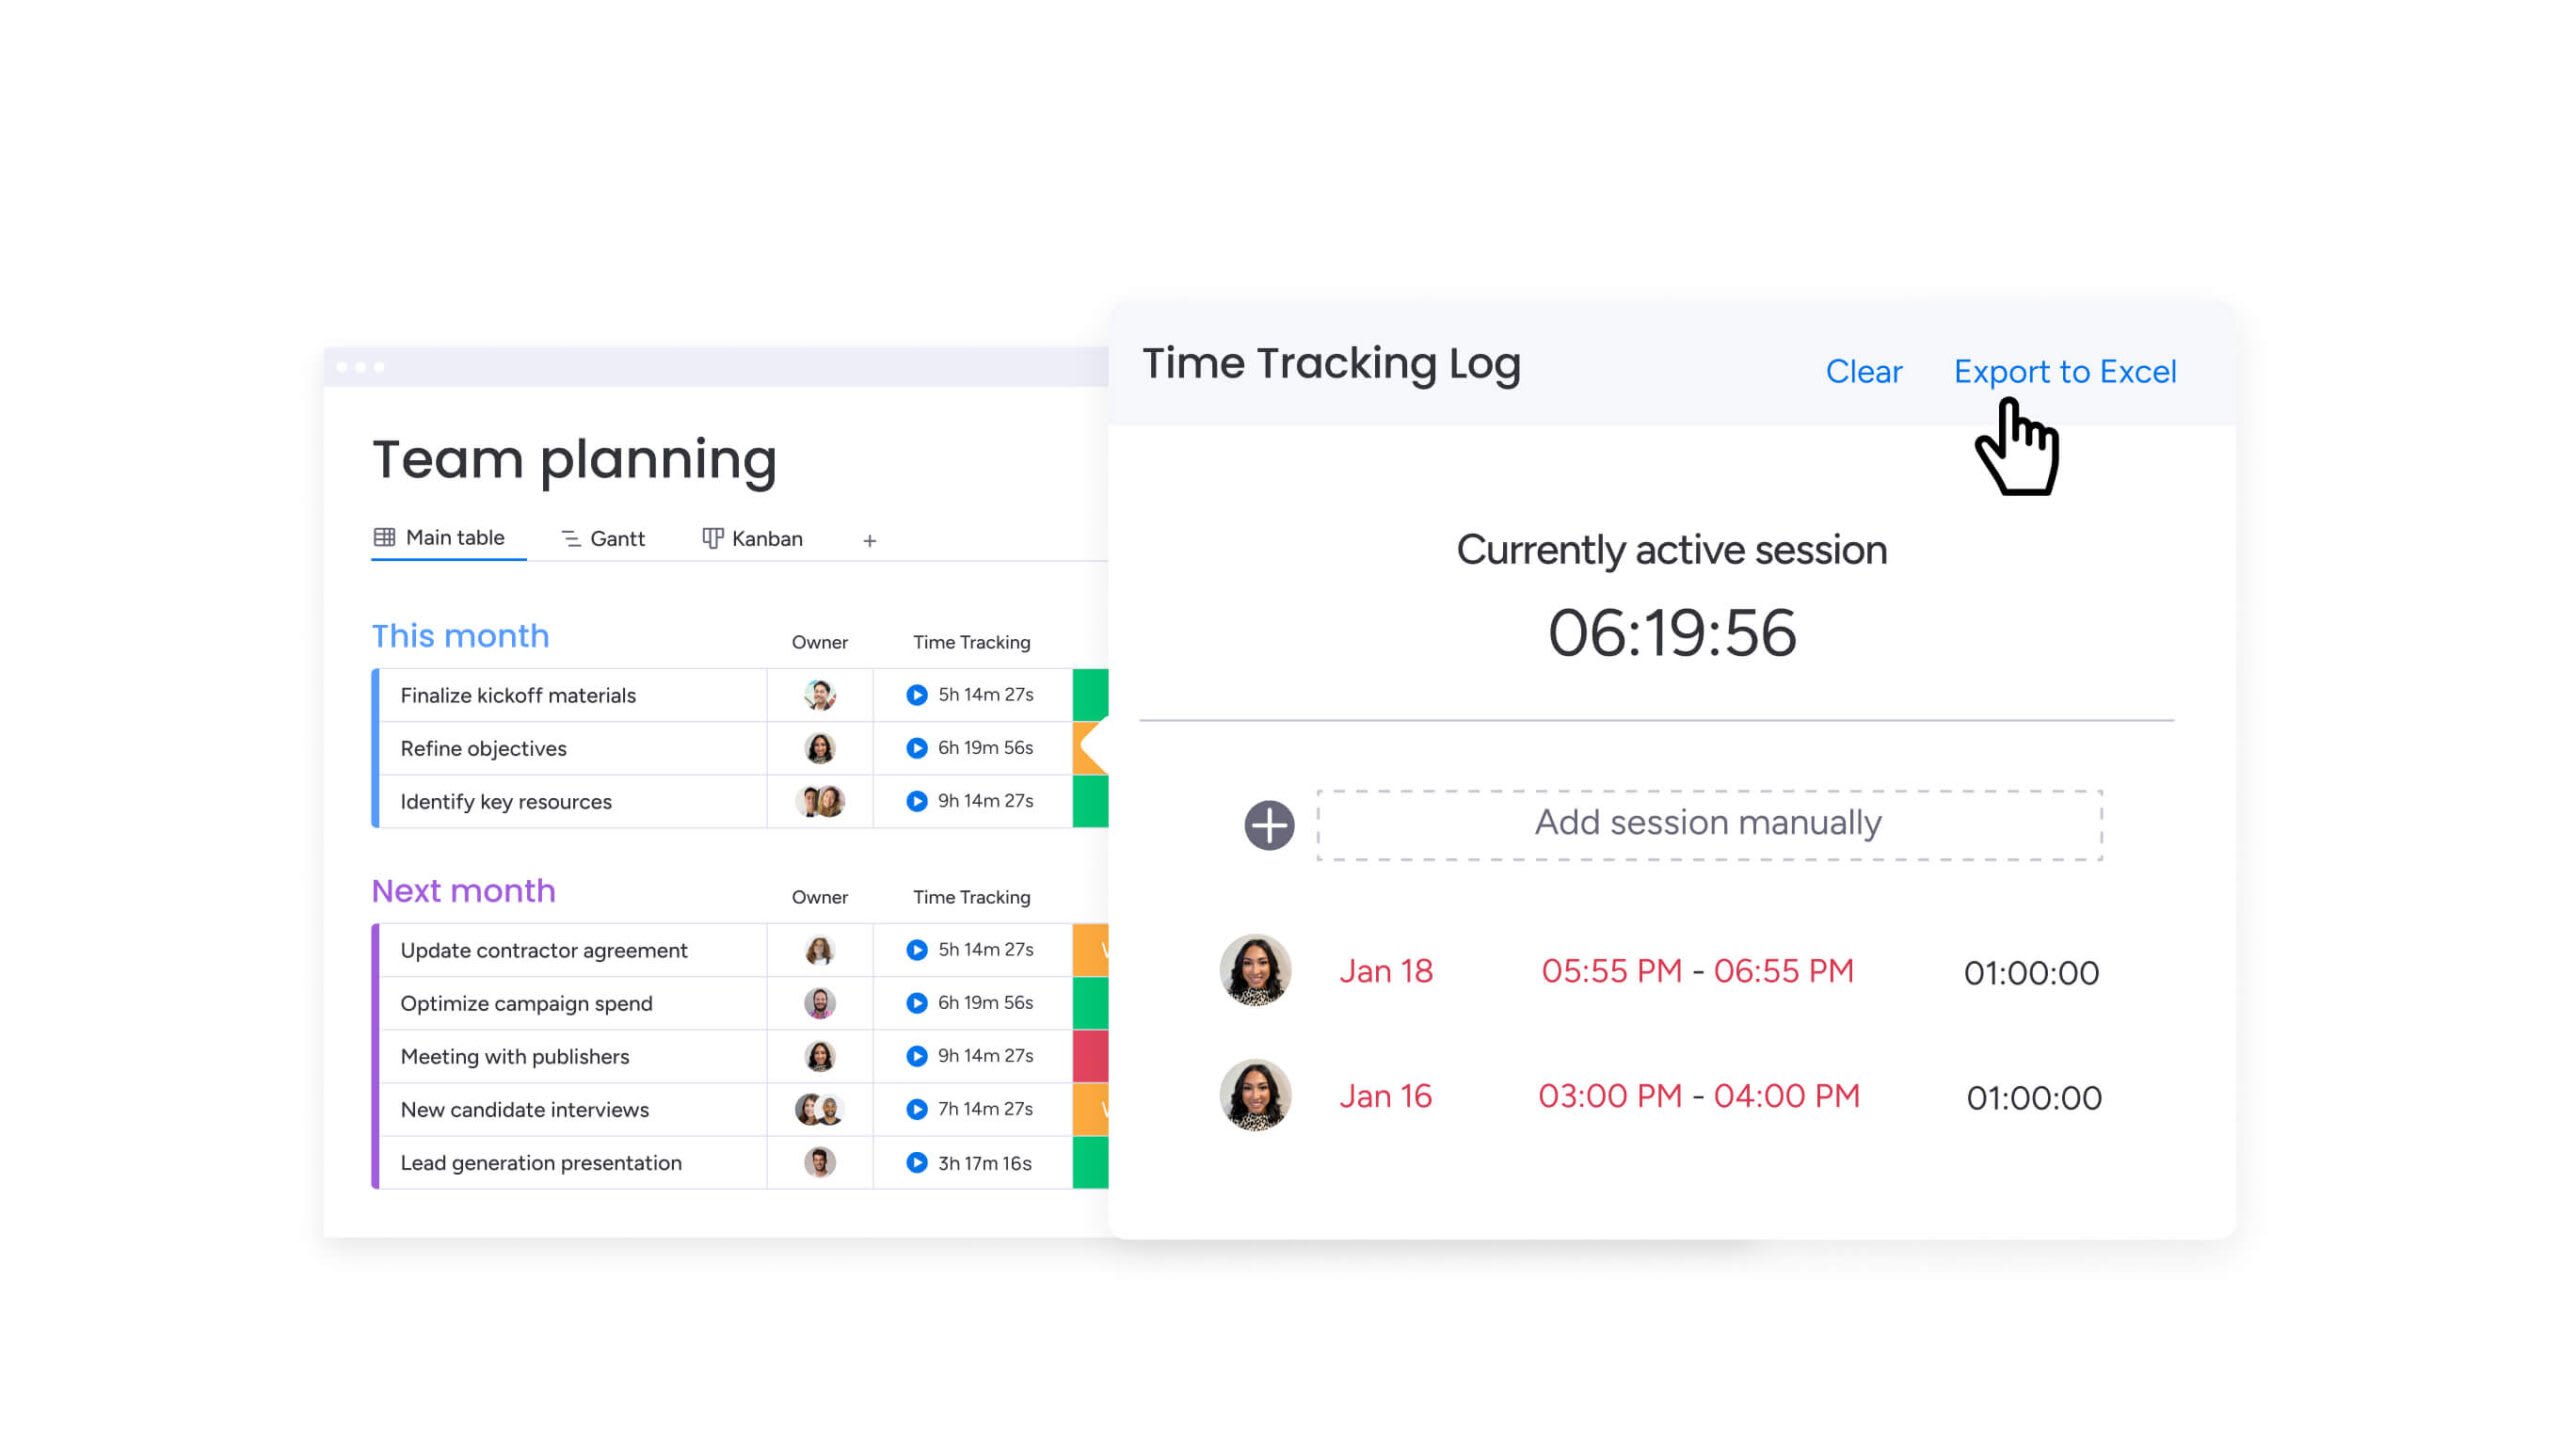
What is cycle time?
Cycle time is simply the total elapsed time a team spends actively working on a task, from the moment work begins until it’s ready for delivery or the next step. This includes any wait times or delays that occur within the active work phases of that specific task.
Example: If a designer starts a task, then waits for feedback before resuming, that feedback wait time (if part of their defined process for that task) is included in the cycle time for that design task.
While cycle time has its roots in manufacturing, its principles are valuable in any team’s workflow, from marketing campaigns and software development sprints to HR onboarding processes and customer support.
A “unit” might be a completed blog post, a resolved support ticket, a designed graphic, or a coded feature. Understanding cycle time helps teams in these diverse fields improve predictability, efficiency, and throughput.
How to calculate cycle time: formula and practical examples
To calculate cycle time, divide the net production time by the number of units completed. As mentioned earlier, the fundamental formula for average cycle time is:
Cycletime (CT) = net production time (NPT) / number of units(U)
Where:
- Net production time (NPT): The total time spent actively working on producing a batch of units or completing a set of tasks. This excludes major downtimes or periods when no work is being done on these specific items.
- Number of units (U): The total number of completed units or tasks in that batch.
This formula gives you the average cycle time per unit. For more granular insights, you’ll often measure the cycle time for individual tasks from their actual start to actual finish. Follow these 5 steps to calculate it consistently:
- Define start and end points: Clearly define what signifies the “start” and “end” of a task’s cycle time. Does “start” mean when a task is assigned, or when someone actively begins working on it? Does “end” mean when it’s first completed, or after review and approval? Consistency is key.
- Track time: Use a reliable method to track the time spent on each task. This could be manual logging, spreadsheets, or ideally monday AI Workspace’s built-in time tracking features.
- Record start and finish times: For each task, note the exact date and time it started and finished according to your definitions.
- Calculate duration: Subtract the start time from the finish time to get the cycle time for that individual task.
- Analyze and aggregate: Analyze individual cycle times or calculate averages for similar types of tasks to understand trends and identify areas for improvement.
Example 1: cycle time for a marketing campaign task
Let’s say your marketing team is working on creating a new landing page.
- Task: Design landing page mock-up.
- Start time: Tuesday, 10:00 AM (designer begins active work).
- End time: Tuesday, 2:30 PM (designer finalizes mock-up, including a 30-minute break).
- Cycle time: 4.5 hours (if breaks are excluded by policy, it would be 4 hours).
Example 2: cycle time for resolving a support ticket
- Task: Resolve a customer’s technical issue.
- Start time: Wednesday, 9:15 AM (support agent picks up the ticket and starts investigation).
- End time: Wednesday, 10:00 AM (agent sends resolution to customer and closes ticket).
- Cycle time: 45 minutes.
Example 3: cycle time for a software dev sprint task
- Task: Develop a new user authentication feature.
- Start time: Monday, Day 1, 1:00 PM (developer starts coding).
- End time: Wednesday, Day 3, 4:00 PM (feature coded, unit tested, and merged).
- Cycle time: 2 days and 3 hours (approximately 19 working hours if following standard 8-hour workdays, excluding non-work time).

What are the benefits of calculating your cycle time?
Tracking and optimizing cycle time isn’t just an academic exercise; it delivers tangible benefits that directly contribute to your team’s success and overall business objectives. The payoff shows up in four areas. Each turns raw cycle-time data into a decision you can act on. Here’s where measuring cycle time makes the biggest difference:
- Visibility into bottlenecks: Consistently high or erratic cycle times reveal which stage is slowing work down.
- Better forecasting: A reliable average lets you promise delivery dates you can hit.
- Higher throughput: Removing delays inside the active work phase means more finished units in the same amount of time.
- Improved morale: Predictable, smooth workflows reduce firefighting and give teams a steady sense of progress.
Gain accurate project estimations and meet deadlines
If you can calculate your average cycle time for common tasks in real time, it’ll enable you to give your customers and stakeholders realistic delivery estimates.
Giving spot-on estimates lets you manage expectations better and deliver what you’ve promised, when you’ve promised. This enhances customer and stakeholder relations and gives your clients confidence in your team.
Identify and eliminate workflow bottlenecks
Consistently high cycle times, or cycle times that vary wildly for similar tasks, often point to bottlenecks in your workflow. By tracking cycle time for different stages of a process (for example, “drafting,” “review,” and “revisions” for a blog post), you can pinpoint where work is slowing down and take targeted action.
Improve team productivity and resource allocation
Understanding your average cycle time allows for better team time management and resource allocation.
When you understand your cycle time, you’ll always know approximately how long it takes you to produce a unit or finish a single task.
From there, you can look at your current and future demand to work out whether you’ve got enough capacity and time to do the job. If not, you might need to adjust priorities, reallocate resources, or manage expectations about delivery timelines.
Enhance customer satisfaction with predictable delivery
Predictable delivery, a direct result of well-managed cycle times, leads to higher customer satisfaction. When clients know what to expect and receive quality work consistently on time, trust and loyalty grow.
Make data-driven decisions for process improvement
Cycle time data provides a quantitative basis for process improvement initiatives. Instead of relying on gut feelings, you can use historical cycle time trends to identify areas for improvement, experiment with changes, and measure their impact.
In project management, this translates to avoiding wasted effort on low-priority tasks or gold-plating deliverables beyond what’s required, so resources are focused effectively.
What's the difference between cycle time and lead time?
Cycle time measures the active work on a task, while lead time measures the full wait a customer experiences from request to delivery. While these related metrics relate to time and efficiency, they measure different aspects of your workflow.
Cycle time: the active work phase
Cycle time is unique because it measures how much time you spend actively working on a task or producing something. The clock for cycle time starts when your team begins an operation on a specific item or task, and it stops at the point at which that item or task is completed and ready for the next step or delivery.
Lead time: the customer’s total wait
Lead time is a little different. Lead time starts when a customer orderor request comes in, and it ends when you deliver the goods or services to that client or stakeholder. Lead time therefore includes cycle time plus any waiting time before work begins (for example, time in a backlog queue) and any waiting time after work is completed but before delivery. If you want the full breakdown of how lead time is measured, it’s worth mapping both metrics side by side.

(Image source)
Example: Imagine a client requests a new marketing brochure on Monday. Your design team starts working on it on Tuesday and completes the design (their cycle time) in 4 hours. But due to other pending requests and internal reviews, the final brochure isn’t delivered to the client until Friday. In this case, the cycle time for the design task was 4 hours, but the total lead time from request to delivery was 5 days.
What's the difference between cycle time and takt time?
Takt time is different from both cycle time and lead time. While cycle time measures how long it takes you to complete a process or a task, takt time is a calculation that determines the pace at which you need to complete work to meet customer or market demand.
“Takt” is another word for “pulse” in German. Just like a heart rate, customer demand can speed up or slow down, and you’ll want to match your production (or service delivery) to suit. By understanding the demands customers are making on your organization, you’ll meet demand without overburdening your team or falling behind. Takt time helps you set a rhythm for your work.
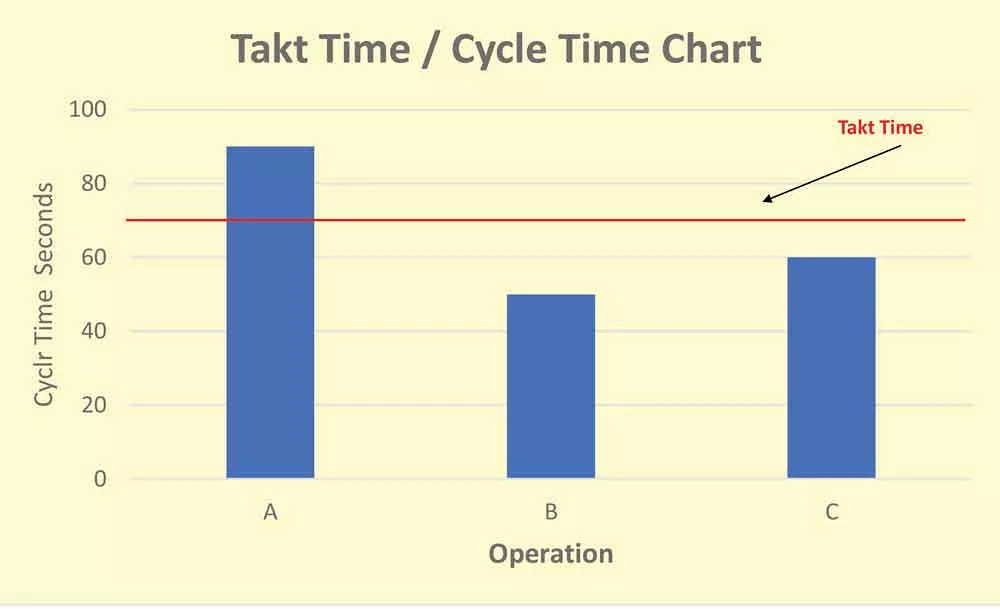 Here’s a formula you can use to calculate takt time:
- Takt = available time / customer demand
Example: If your marketing team needs to produce 20 social media posts per week (customer demand) and has 40 available work hours in that week (available time), the takt time is 40 hours / 20 posts = 2 hours per post. On average, a post needs to be completed every 2 hours to meet demand. Your actual cycle time for creating a post might be more or less than this.
Simply put: cycle time is all about how long it takes to complete a task. Lead time is the total time from request to delivery. Takt time is a customer demand calculation that tells you how often a task should be completed to meet demand.
Here’s a quick table to summarize the differences:
| Cycle time | Lead time | Takt time | |
|---|---|---|---|
| Starts when | Work begins on a specific task or item | Customer or stakeholder makes a request | Not applicable, it's a calculated rate |
| Ends when | Task or item is completed and ready for the next step or delivery | Request is fulfilled and delivered to the customer or stakeholder | Not applicable, it's a calculated rate |
| Measures what | Time spent actively working on a task | Total time the customer or stakeholder waits for fulfillment | Required pace of production or completion to meet demand |
| Primary goal | Improve process efficiency and reduce active work time | Improve overall customer experience and reduce total wait time | Synchronize production or work rate with customer demand |
7 strategies to reduce and optimize cycle time
Understanding and calculating cycle time is the first step. The real value comes from using this information to actively reduce and optimize it. These 7 strategies target the most common sources of delay, from unclear definitions to manual handoffs:
- Clearly define task start and end points: Make sure everyone on the team shares the same understanding of when a task officially starts and when it’s considered complete. This consistency is crucial for accurate measurement and for identifying true areas for improvement.
- Limit work in progress effectively: Encouraging team members to finish current tasks before starting new ones can significantly reduce cycle times. High work in progress often leads to context switching, delays, and reduced throughput.
- Visualize your workflow to catch stalls early: Seeing every task and its stage makes slow steps obvious. The Kanban method pairs a visual board with limits on how much work sits in each column, which keeps flow steady and cycle time low.
- Streamline handoffs between team members: Handoffs are common points where delays occur. Map out your processes to identify handoff points and look for ways to make them smoother and faster. Clear communication protocols and defined responsibilities help.
- Automate repetitive, manual steps: Notifications, status updates, and task assignments eat time between stages. The AI Workspace’s no-code automation recipes can handle these handoffs and even start or stop timers when a status changes, so work moves forward without waiting on a person, and real-time Dashboards keep the whole flow visible.
- Improve task clarity and requirement gathering: Ambiguous tasks or incomplete requirements lead to rework and delays. Invest time upfront to make sure tasks are well-defined, with clear acceptance criteria, before work begins.
- Foster a culture of continuous feedback and improvement: Regularly review your cycle time data with the team. Hold retrospectives to discuss what’s working, what’s not, and where you can improve. Encourage experimentation and learning, and lean on better time management habits across the team.

Common challenges in managing cycle time and how to overcome them
Managing and reducing cycle time can present challenges. Here are a few common ones and how to address them:
- Inconsistent task definitions: When “done” means different things to different people, cycle time data gets skewed. Standardize task definitions and create clear “Definition of Done” criteria for various task types. Use templates on monday.com to enforce consistency.
- Hidden wait times: Time spent waiting for information, approvals, or resources can inflate cycle times. Map your value stream to identify all steps, including wait states. Use status columns to explicitly track “waiting for X” stages and analyze time spent in them, which makes it easier to identify workflow bottlenecks.
- Resistance to tracking: Team members might feel micromanaged if time tracking is introduced poorly. Communicate the “why” behind tracking cycle time, focusing on process improvement rather than individual performance policing. Use the platform’s integrated timer and Automations to make time tracking effortless.
- Scope creep: Tasks growing larger than initially planned will naturally extend cycle times. Implement clear scope management processes. Break down large tasks into smaller, manageable sub-items on your boards.
How monday AI Workspace helps you master cycle time
Measuring cycle time by hand works until your team grows. Spreadsheets go stale, timers get forgotten, and the delays you most need to see stay hidden.
monday AI Workspace captures cycle time as a natural byproduct of the work itself, then turns that data into action across every type of work.
- Automatic time capture: The Time Tracking column records active work time on every item, and formula columns calculate how long a task sits in each status, so cycle time is measured without anyone starting a stopwatch.
- Real-time flow visibility: Dashboards consolidate work data into live views of progress and stage duration, and AI-powered risk alerts and AI-generated summaries find developing bottlenecks before they slow delivery.
- Fewer manual handoffs: Automations use no-code recipes to move items to the next stage, reassign owners, and start or stop timers on a status change, cutting the idle time between steps.
- Proactive process support: monday agents are task-specific AI workers that run in the background. A Risk Analyzer agent, for example, flags stalled items and recurring delays so your team can act early. People and Agents work the process together, with people making the calls.
- Answers in plain language: monday sidekick lets you ask about cycle-time trends in conversation, so a manager can check where work is slowing without building a report. Sidekick locates the data directly in the flow of work.
The Project Tracker Template gives teams a ready-made board with these pieces already in place, so you can start capturing cycle time on day one and customize the workflow to match how your team works.
Here’s how automated cycle-time tracking compares to a manual or spreadsheet approach:
| Cycle-time task | Manual or spreadsheet tracking | monday AI Workspace |
|---|---|---|
| Capturing active work time | Start and stop a stopwatch by hand, then copy figures into a sheet | The Time Tracking column logs active time automatically and formula columns calculate elapsed time in each status |
| Spotting bottlenecks | Scan rows manually and hope someone notices a stalled task | Dashboards show real-time flow and AI-powered risk alerts flag developing bottlenecks before they slow delivery |
| Forecasting delivery | Estimate from memory or past guesses | Historical cycle-time trends in Dashboards turn past data into realistic delivery dates |
| Managing handoffs between stages | Chase updates over email and chat | Automations move items to the next stage, reassign owners, and start or stop timers on a status change |
| Reporting to stakeholders | Rebuild a report by hand each week | AI-generated summaries and scheduled reports keep stakeholders current without manual work |
Turn cycle time into faster, predictable delivery
Cycle time turns delivery from guesswork into something you can plan. When you know how long work takes, you can find the stages where it stalls, streamline the steps around them, and give stakeholders dates built on evidence instead of optimism. Differentiating cycle time from lead time and takt time sharpens that view even further.
The next step is moving from measuring cycle time to monitoring it continuously. As AI-assisted flow tracking becomes standard, the teams that pull ahead will be the ones who spot a slowdown the day it starts, not the week after a deadline slips.
FAQs
What is a good cycle time?
A good cycle time depends on your task type, team size, and complexity, so there's no universal number. Establish your own baseline by tracking current cycle times, then work to shorten it steadily. Compare against your own historical trends rather than an external benchmark.
Does cycle time include wait time?
Cycle time includes wait time that happens inside the active work phase, such as pausing a task to wait for feedback before resuming. It excludes waits before work starts or after it finishes, which belong to lead time instead.
Is cycle time only important for repetitive tasks?
Cycle time is not only important for repetitive tasks. Repetitive work benefits from benchmarking, while unique projects benefit from tracking cycle time per phase, which sharpens future estimates and exposes systemic bottlenecks that affect every project your team runs.
How does improving cycle time impact team morale?
Improving cycle time lifts team morale by replacing firefighting with steady, predictable progress. Shorter, more reliable cycles mean clearer expectations, fewer last-minute rushes, and a visible sense of accomplishment as tasks move smoothly through each stage of the workflow.
How can AI Workspace automate cycle time tracking?
The AI Workspace automates cycle time tracking with the Time Tracking column and formula columns that log active work time and calculate elapsed time per status. Automations start and stop timers on status changes, and Dashboards spot trends and bottlenecks automatically.
Can you track cycle time for sub-items on monday AI Workspace?
Yes, you can track cycle time for sub-items on monday AI Workspace. Add Time Tracking and status columns to sub-items to measure cycle time at a granular level, and those figures roll up to the parent task for a complete view of the work.

 Get started