Planning complex work usually feels straightforward at first. Ideas make sense, priorities line up, and everyone leaves the room thinking they’re aligned. It’s only once execution begins that cracks start to show, as dependencies surface late, ownership blurs, and shared understanding quietly drifts.
Concept maps help prevent that breakdown by making thinking visible. They show how ideas connect, where decisions depend on one another, and how changes in one area ripple through the rest of the work. Instead of flattening complexity into lists, concept maps let teams see the system they’re actually working within.
The sections ahead unpack how concept maps work in practice, how they differ from mind maps, and where they add the most value across planning, projects, and processes. You’ll also see practical ways teams use them collaboratively, supported by modern solutions like monday work management, to move from ideas to execution without losing clarity.
Key takeaways
- Transform visual plans into trackable work: monday work management converts concept map nodes into executable items with owners, deadlines, and real-time progress tracking so strategy becomes action.
- Use concept maps to reveal hidden business connections: visualize how departments, processes, and resources interconnect to uncover dependencies that linear planning misses and prevent costly oversights.
- Start with a focused question, not scattered brainstorming: define exactly what problem you’re solving before mapping concepts to create actionable diagrams instead of confusing visual clutter.
- Choose concept maps over mind maps for complex systems: concept maps show explicit relationships between multiple ideas while mind maps only branch from one central topic.
- Label every connection with specific relationship words: use precise terms like “requires” or “funds” instead of vague lines to create clear, actionable business logic anyone can follow.
A concept map is a visual diagram that shows relationships between ideas, processes, or information through connected nodes and labeled links. It’s essentially a blueprint for your thinking — each idea becomes a bubble or box (called a node), and lines with descriptive labels connect these nodes to show exactly how concepts relate to each other.
Instead of just drawing a line between “Marketing Campaign” and “Target Audience,” you’d label that line with “reaches” or “engages.” This creates a complete thought: “Marketing Campaign reaches Target Audience.”
Joseph Novak created concept maps in the 1970s for education, but they’ve become essential business planning frameworks. They help organizations model complex systems like enterprise software architecture or organizational change management. By making internal knowledge visible and shareable, concept maps bridge the gap between high-level strategy and daily operations.
Visual networks that connect ideas
Concept maps function as visual networks with two primary components that work together to create meaningful business insights. Get these components right, and your maps actually drive decisions instead of collecting dust in a folder.
Nodes represent the concepts themselves — the “nouns” of your map. These might include:
- Tangible elements: “Product Launch,” “Budget,” or “QA Testing”.
- Intangible elements: “Customer Satisfaction” or “Brand Reputation”.
- Process elements: “Data Migration” or “User Training”.
Links provide the real power through lines connecting nodes that include linking words or phrases defining the relationship. These linking words act as the “verbs” of your map: “requires,” “leads to,” “influences,” or “is part of.”
For example, when you connect “Marketing Campaign” to “Target Audience” with a line labeled “reaches,” you create a complete proposition that anyone can understand.
Business applications and benefits
Concept maps deliver tangible value by structuring complexity in ways that linear text cannot. Know where concept maps work best, and you’ll use them in the right places — not everywhere.
- Strategic planning: executives visualize market forces, competitive landscapes, and internal capabilities. A map might connect “Market Expansion” to “Regulatory Compliance” via “requires,” which helps ensure all critical dependencies are identified.
- Project dependency mapping: project managers identify bottlenecks by visualizing work items. Seeing that “Feature A” depends on “API Integration” helps teams sequence work correctly.
- Process documentation: operations teams reveal workflow redundancies. Maps show how data flows between departments, highlighting where handoffs fail or approval loops cause delays.
- Knowledge management: organizations capture institutional wisdom by mapping expert knowledge, preserving critical information when senior employees leave.
- Problem solving: teams map root causes and symptoms. Visualizing causal relationships contributing to “Customer Churn” helps identify systemic solutions rather than superficial fixes.
Knowing the difference between concept maps and mind maps matters — it’s how you pick the right tool for the job. Both visualize information, but they’re built for completely different jobs.
Mind maps are generative tools for brainstorming and memory association, centering on a single topic. Concept maps, on the other hand, are structural tools for logical analysis and system modeling, focusing on relationships between multiple topics.
| Feature | Concept map | Mind map |
|---|---|---|
| Structure | Network (web-like) | Radial (tree-like) |
| Focus | Logical relationships and systems | Brainstorming and creative association |
| Central point | Multiple main concepts or entry points | Single central topic |
| Connections | Explicitly labeled (e.g., "causes," "requires") | Unlabeled branches (associative) |
| Complexity | High: handles complex, many-to-many relationships | Low to medium: handles hierarchical lists |
| Best for | System analysis, strategic planning, process mapping | Ideation, meeting notes, memorization |
Structure and organization methods
How they’re structured changes what they’re good for. Each one organizes information differently, which means they help you think through different types of problems.
Mind maps: use a radial structure with a central idea in the middle and related sub-topics branching out in a starburst pattern. This mimics rapid brain associations but lacks rigorous logical structure.
A mind map for a marketing campaign places “Campaign” in the center with branches for “Email,” “Social,” and “Events.”
Concept maps: use a network structure allowing cross-connections between different branches. This reflects how business elements interconnect rather than just hierarchy. A concept map for the same campaign shows how “Social Media” drives traffic to the “Landing Page,” and how the “Landing Page” captures data for “Email Automation.”
This reveals the system’s logic, not just its components.
When to choose each approach
Pick based on what you’re trying to figure out and how complicated the connections are. Here’s when to use each method based on specific business scenarios:
Choose a concept map when:
- Planning complex projects where you need to visualize dependencies and multiple interconnected work streams.
- Mapping cross-departmental processes to show how sales, finance, and legal interact during contract negotiation.
- Connecting high-level business goals with specific operational initiatives and resource requirements.
- Documenting technical systems where components interact in non-linear ways.
Choose a mind map when:
- Brainstorming individually to generate ideas quickly without worrying about structure.
- Taking meeting notes and capturing key points from discussions in real-time.
- Organizing simple hierarchies like outlining a blog post or presentation structure.
- Exploring potential themes for creative projects.
Combining both for maximum impact
The smartest teams use both — starting with mind maps for brainstorming, then switching to concept maps for structure. This way, you capture the creative stuff first, then organize it into something logical.
Start with a mind map to capture all possible ideas, stakeholders, and requirements during brainstorming. This phase prioritizes quantity and creative freedom. Then transition to a concept map to structure those ideas. Identify relationships, dependencies, and logical flows between concepts from the mind map.
For product development, a mind map captures feature ideas, while the subsequent concept map organizes those features into a development roadmap showing how Feature X enables Feature Y and supports Business Objective Z.
Essential elements of concept maps
Four elements turn concept maps from simple drawings into tools that actually drive business decisions. Get these right, and your maps help teams make real decisions and stay aligned on strategy.
- Concepts (nodes): the fundamental building blocks representing tangible elements like “Quarterly Revenue” or “Project Manager,” as well as intangible elements like “Customer Satisfaction.” Concepts are enclosed in shapes and labeled concisely.
- Linking words (relationships): labels defining connections between concepts. Common business linking words include “mitigates,” “funds,” “reports to,” and “validates.” Precise linking words prevent ambiguity — “impacts” is vague, while “decreases budget for” is actionable.
- Cross-links: connections between concepts in different domains or map segments. Cross-links reveal how “Employee Training” affects “Customer Support Resolution Time” — often representing the highest-value insights.
- Hierarchical organization: business concept maps typically flow from general to specific. Strategic concepts like “Company Vision” sit at the top, cascading to departmental goals and specific metrics at the bottom.
“monday.com has been a life-changer. It gives us transparency, accountability, and a centralized place to manage projects across the globe".
Kendra Seier | Project Manager“monday.com is the link that holds our business together — connecting our support office and stores with the visibility to move fast, stay consistent, and understand the impact on revenue.”
Duncan McHugh | Chief Operations Officer5 ways concept maps transform business thinking
Concept maps do more than visualize data. They change how teams process information and solve problems. Switching from linear to network thinking helps teams execute more effectively and stay aligned on complex projects.
1. Simplify complex information
Concept maps take complex business data and turn it into visuals people can actually understand and act on fast. They turn 50-page requirement docs into one visual that stakeholders get in seconds.
In enterprise software implementation, a concept map can visualize the entire ecosystem. It shows how legacy systems, new platforms, data migration streams, and user permissions interconnect. Executives understand the full scope of digital transformation in minutes instead of hours, which speeds up approvals and resource decisions.
2. Accelerate team understanding
People process visuals way faster than text, which makes concept maps great for getting cross-functional teams aligned. Concept maps get everyone on the same page — technical and non-technical people alike.
During product launches, concept maps help engineering teams understand why specific feature deadlines are critical for marketing’s press embargo. Everyone sees the same thing, which cuts down on miscommunication and keeps departments working from the same project reality.
3. Reveal hidden connections
Linear planning hides the ripple effects that can tank your project or open up new opportunities. Concept maps show you connections traditional analysis misses — especially between business areas that seem unrelated.
A map might reveal that a proposed cost-cutting measure in IT support inadvertently breaks a feedback loop essential for product development. By making these “invisible” dependencies explicit, organizations avoid unintended consequences. Discovering that “Customer Service Response Time” directly influences “Renewal Rate” allows teams to prioritize operational improvements driving revenue.
4. Speed up decision making
Teams freeze when they can’t predict what’ll happen or see how one decision affects everything else. Concept maps speed up decisions by letting leaders see consequences and weigh trade-offs on the spot.
When leaders see that Decision A leads to Outcome B, which requires Resource C, they evaluate trade-offs instantly. In crisis response, concept maps also help teams understand cascading effects of different mitigation strategies, allowing rapid, data-backed choices under pressure.
5. Align strategic vision
Concept maps connect daily work to long-term strategy so everyone sees how their work fits into bigger company goals. They visually link high-level objectives like “Market Leadership” to specific initiatives like “Mobile App Launch” and individual work items.
This alignment ensures every employee understands how their contribution supports broader organizational goals. During mergers or restructuring, concept maps help teams understand how different organizational units will integrate, reducing anxiety and maintaining productivity.
How to create a concept map in 6 steps
Good concept mapping follows a process that keeps your final map logical, readable, and useful. This workflow takes you from defining the problem to refining the map — so you build something that drives decisions, not just pretty pictures.
Step 1: start with your central question
Every good concept map starts with a focus question — what problem are you solving or what knowledge are you mapping? Vague focus creates sprawling, useless maps that confuse people instead of helping them.
Good business focus questions are specific and actionable: “How does our supply chain impact customer satisfaction?” or “What are the prerequisites for Q3 cloud migration?” This question keeps you focused so every concept you add actually matters.
Step 2: list your main concepts
Before you draw anything, brainstorm all the key concepts related to your focus question. Don’t worry about structure yet. This “parking lot” exercise captures ideas from stakeholder interviews, project documentation, and strategic goals.
In business contexts, categories often include:
- Stakeholders: teams, customers, vendors, executives.
- Processes: workflows, approvals, handoffs, reviews.
- Platforms: software systems, databases, communication tools.
- Metrics: KPIs, deadlines, budgets, quality measures.
- Constraints: regulations, resources, timelines, dependencies.
Start with 10-15 core concepts so your map doesn’t get overwhelming right away.
Step 3: arrange ideas hierarchically
Take concepts from your list and arrange them on the canvas by importance and scope. Place the most general, inclusive, or strategic concepts at the top. Arrange specific, operational, or supporting concepts below them.
For strategic plans, “Increase Market Share” sits at the top, “New Product Development” in the middle, and “Hire React Developers” at the bottom. This hierarchy creates logical flow and shows what’s driving your main business initiatives.
Step 4: draw connecting lines
Draw lines between related concepts to turn your collection into a network that shows how things connect. Ask “How does Concept A relate to Concept B?” and “What happens to B if A changes?”
Connections can be:
- Vertical (hierarchical): strategic to tactical relationships.
- Horizontal (process flow): sequential workflow steps.
- Diagonal (cross-links): dependencies across different domains.
Use different line styles (solid, dashed, colored) to show different relationship types like financial flows versus data flows.
Step 5: add relationship labels
This step turns your map into something anyone can read and understand accurately. Every line must be labeled with a linking word or phrase defining the relationship.
Labels should be specific: use “authorizes” instead of “relates to,” or “provides data for” instead of “connects to.” Users should read any two connected nodes and their link as a complete sentence: “Sales Team updates CRM Record.”
Step 6: review and optimize
Your first draft won’t be your last. Collaborative review catches what you missed and makes sure it’s accurate. Review means checking for missing concepts, redundant connections, or vague labels that make your map less useful.
Teams look for opportunities to:
- Simplify complex clusters: ones that confuse rather than clarify.
- Add valuable cross-links: that are missed initially.
- Remove redundant relationships: that clutter the visual.
- Clarify vague labels: with specific, actionable language.
Collaborative review makes sure the map captures what the whole team knows, not just one person’s view.
7 powerful concept map examples
Concept mapping works across every business function, solving real problems through visual structure. These examples explored below show how different departments get more value from mapping relationships than just listing parts.
1. Strategic planning concept maps
Strategic concept maps help companies match their resources to market opportunities and spot gaps in what they can do versus competitors. For example, tech firms map relationships between “emerging AI trends,” “competitor weaknesses,” and “internal R&D capabilities.”
The map reveals that while market opportunity is high, the “Current Talent Pool” has a “lacks” relationship with “Machine Learning Expertise,” identifying critical hiring priorities before strategy execution.
2. Project dependency mapping
Project managers visualize critical paths in complex deployments where multiple work streams must coordinate precisely. Software implementation maps connect “Data Migration,” “User Training,” and “Go-Live” with specific dependency relationships.
Maps highlight that “User Training” cannot begin until “Staging Environment” is “populated with” “Migrated Data.” This visualization prevents the common error of scheduling training before system readiness.
3. Process workflow visualization
Operations teams process map customer onboarding journeys showing relationships between departments and handoff points. Process maps connect “Sales Handoff,” “Account Setup,” and “Welcome Email” with timing and dependency labels.
Maps reveal that “Account Setup” currently “requires” “Manual Data Entry,” which “causes” “24-hour Delay.” This insight leads to automation initiatives removing bottlenecks.
4. Knowledge management systems
Consulting firms map collective expertise to staff projects effectively and preserve institutional knowledge. Concept maps connect “Healthcare Industry” to specific “Case Studies,” “Methodologies,” and “Subject Matter Experts.”
When new healthcare projects land, resource managers instantly see relationships between client needs and firm assets, ensuring the right team assembly.
5. Problem-solution frameworks
Teams addressing high customer churn use concept maps to move beyond symptoms and identify root causes. Maps connect “Churn Rate” to “Product Stability,” “Customer Support Wait Times,” and “Competitor Pricing.”
Maps reveal that “Product Stability” is “influenced by” “Technical Debt,” which “results from” “Rushed Q1 Release.” This traces root causes back to engineering practices rather than just support team performance.
6. Resource planning maps
During budget season, executives map relationships between strategic goals and capital requirements to make informed allocation decisions. Maps show that “Expansion into Asia” “requires” “Localization Budget” and “Legal Retainer.”
This visualizes trade-offs: cutting the “Legal Retainer” node breaks the link to “Regulatory Compliance,” making expansion impossible.
7. Customer journey mapping
E-commerce teams map customer experience ecosystems connecting touchpoints with conversion factors. Maps link “Social Ad” to “Mobile Site Speed” to “Checkout Flow” to “Post-Purchase Support.”
Maps highlight that “High-Converting Ad” connected to “Slow Mobile Site” results in “High Bounce Rate,” pinpointing exactly where the funnel leaks revenue.
Concept map templates for quick starts
Templates speed things up by giving you a starting point and keeping maps consistent across teams. They also make it much easier to start and let teams focus on content instead of figuring out structure.
Template categories addressing common business mapping needs include:
- Strategy and planning templates: feature top-down hierarchy starting with Vision and Mission. Include pre-defined categories for Objectives, Key Results, Initiatives, and KPIs. Standard relationships include “supports,” “measures,” and “contributes to.”
- Project management templates: focus on execution with structure for Phases (Initiation, Planning, Execution, Closure) and nodes for Deliverables, Milestones, Risks, and Stakeholders. Relationships focus on dependencies like “blocks,” “precedes,” and “enables.”
- Team collaboration templates: organize people and roles with nodes for Team Members, Skills, Responsibilities, and Communication Channels. Essential for understanding “who does what” and “who reports to whom” in matrix organizations.
- Business process templates: structure workflows with standard shapes for Inputs, Processes, Decisions, and Outputs. Designed to identify loops, bottlenecks, and integration points between systems.
Collaborative concept mapping for teams
Distributed teams need ways to get on the same page without huddling around a whiteboard. For distributed teams, concept mapping really needs platforms with real-time collaboration, structured feedback, and version control for complex projects.
Real-time multi-user editing
Cloud platforms let multiple people build concept maps at the same time, just like working together in person. During strategic planning workshops, marketing, sales, and product leaders contribute to the same board in real-time.
As the Product Lead adds a node for new features, the Marketing Lead immediately draws connections to specific customer segments, and the Sales Lead adds constraints regarding pricing. Working together in real-time means the final map shows the full business picture and keeps teams from working in silos.
Comment and feedback systems
You refine the map through feedback loops that keep discussions focused on specific concepts. Team members leave comments on specific nodes or links requesting clarification or suggesting alternatives.
Stakeholders might tag a node labeled “Q3 Launch” and comment, “This dependency on Vendor X puts the timeline at risk.” Discussions happen right on the map, so conversations stay focused instead of getting lost in email.
Version history and tracking
Always remember that complex projects change, and your maps need to change with them to stay useful. Digital platforms maintain complete change history, allowing teams to revert to previous versions or audit how strategy has shifted over time.
This matters for long-term projects where you need to remember why you made certain decisions six months back. Version tracking provides an audit trail of strategic thinking.
AI-enhanced concept mapping
AI helps with strategic thinking by automating the manual parts of mapping and spotting patterns people miss. AI acts like a co-pilot — it speeds up map creation but leaves the strategic calls to teams who know the business.
Automated relationship discovery
AI algorithms analyze your business data (project databases, docs, communication logs) and suggest relationships based on patterns. If organizational data shows “Server Downtime” frequently precedes “Support Ticket Spikes,” AI suggests a causal link between these concepts.
This helps teams spot dependencies using actual data instead of just gut feel. Organizations using monday work management can leverage AI Blocks to automatically categorize concepts, extract key information from documents, and summarize complex topics into map-ready nodes.
Intelligent suggestion systems
AI helps while you’re building by suggesting concepts you might’ve missed based on similar projects. If users create a map for “GDPR Compliance” but omit “Data Breach Protocol,” the system suggests adding it based on patterns from similar compliance maps.
AI can also suggest more precise relationship labels, prompting users to change vague “relates to” links to specific “governs” links. monday work management’s AI capabilities help teams detect sentiment in stakeholder feedback, suggest action items from meeting notes, and identify potential risks across project portfolios.
Natural language processing
Natural Language Processing turns text into visual structure, cutting the time it takes to go from docs to usable maps. Teams upload strategic plan documents or meeting transcripts, and AI extracts key entities and relationships to generate initial concept maps.
This cuts way down on the time between brainstorming docs and structured visual models. Teams get working drafts instantly and refine them based on what they know.
Turn concept maps into executable workflows with monday work management
Traditional concept mapping stops at visualization. Maps stay static pictures disconnected from actual work. monday work management bridges this gap by turning visual plans into workflows teams can track, automate, and optimize in real-time.
| Feature | Traditional concept mapping | monday work management |
|---|---|---|
| Output | Static image or PDF | Dynamic, trackable workflow board |
| Actionability | None (reference only) | High (assignable items, due dates) |
| Updates | Manual redrawing required | Real-time status updates |
| Integration | Disconnected from other platforms | Integrated with CRM, dev, and support |
| Automation | None | Automated dependencies and notifications |
Dynamic concept map integration
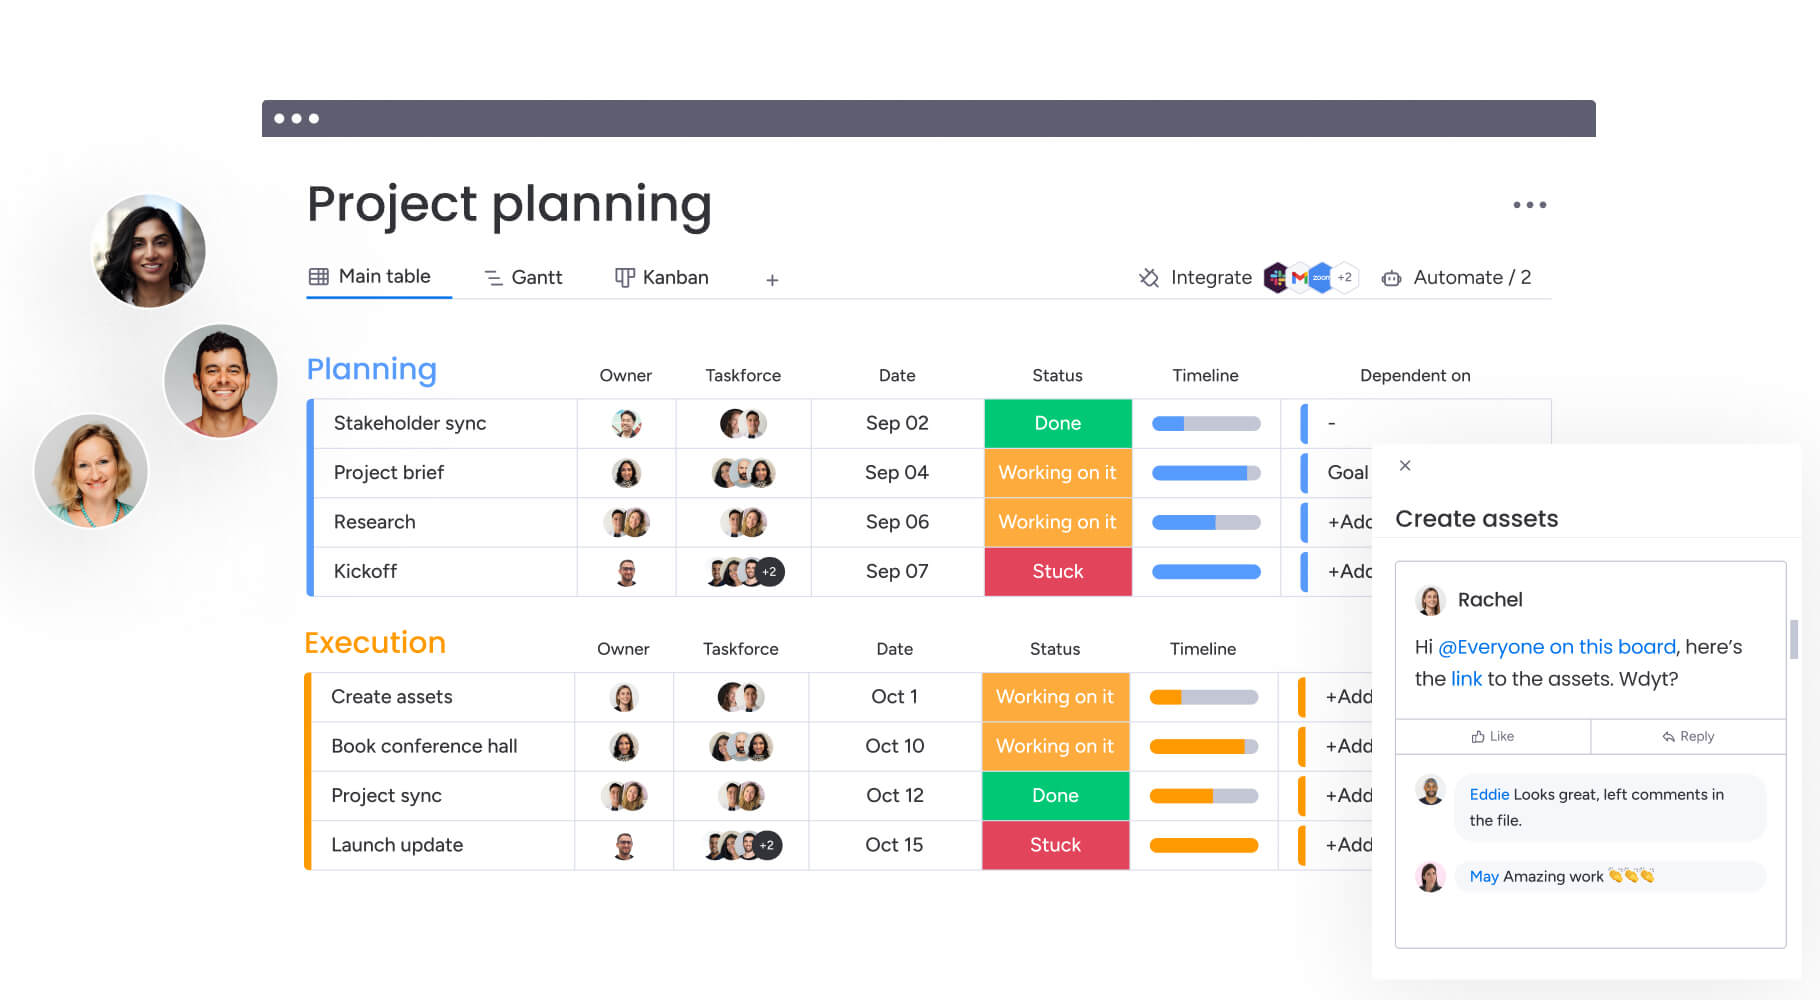
Teams turn concept map nodes into board items, keeping the strategic structure intact while tracking execution. A concept labeled “Q3 Marketing Campaign” becomes a project item with an owner, deadline, and status. Visual hierarchy preserves through groups and sub-items, ensuring strategic structure remains intact as work begins.
This integration means plans and execution live in the same place. Teams connect their strategic thinking directly to dashboards, automations, and integrations with existing tech stacks.
Automated workflow generation
The intelligent platform uses concept map logic to automate workflow setup, cutting out manual translation between planning and execution. If a concept map shows “Design” requires “Copy,” monday work management automatically sets up dependencies where Design items are blocked until Copy items complete.
AI analyzes map structure and suggests item lists and templates, turning high-level strategy maps into detailed project plans instantly. Teams go from concept to execution without manual work or losing context.
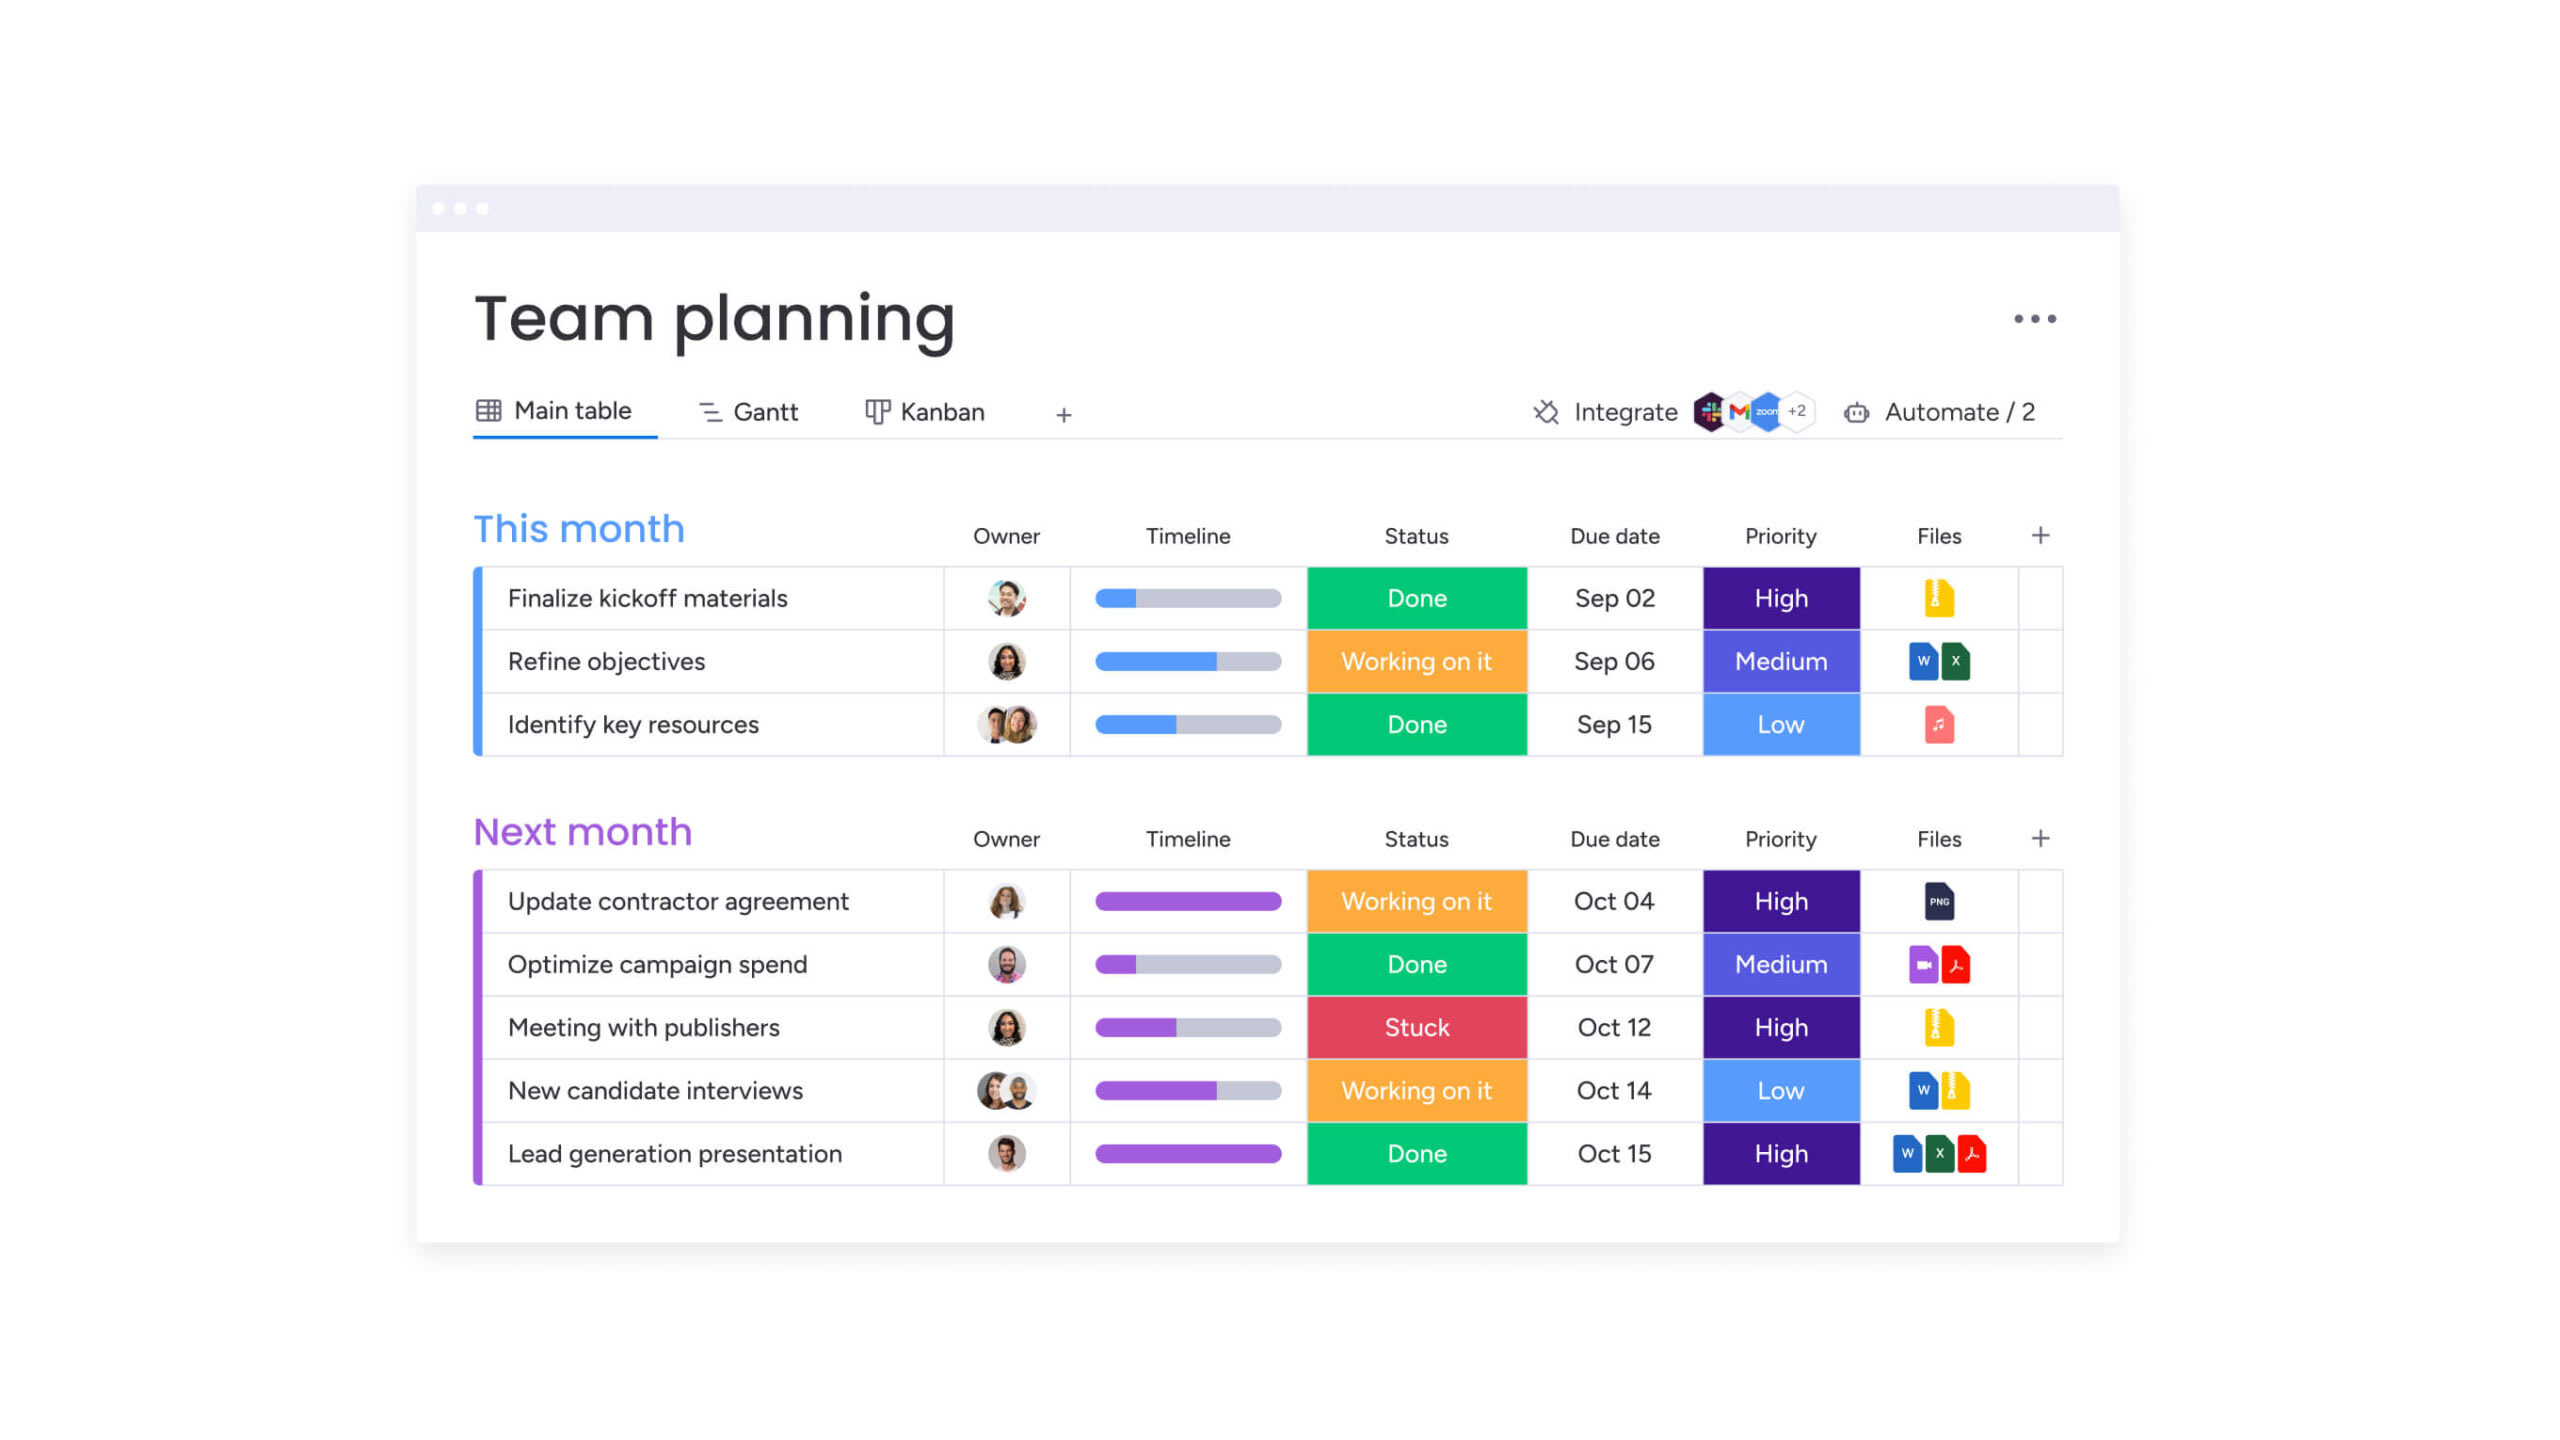
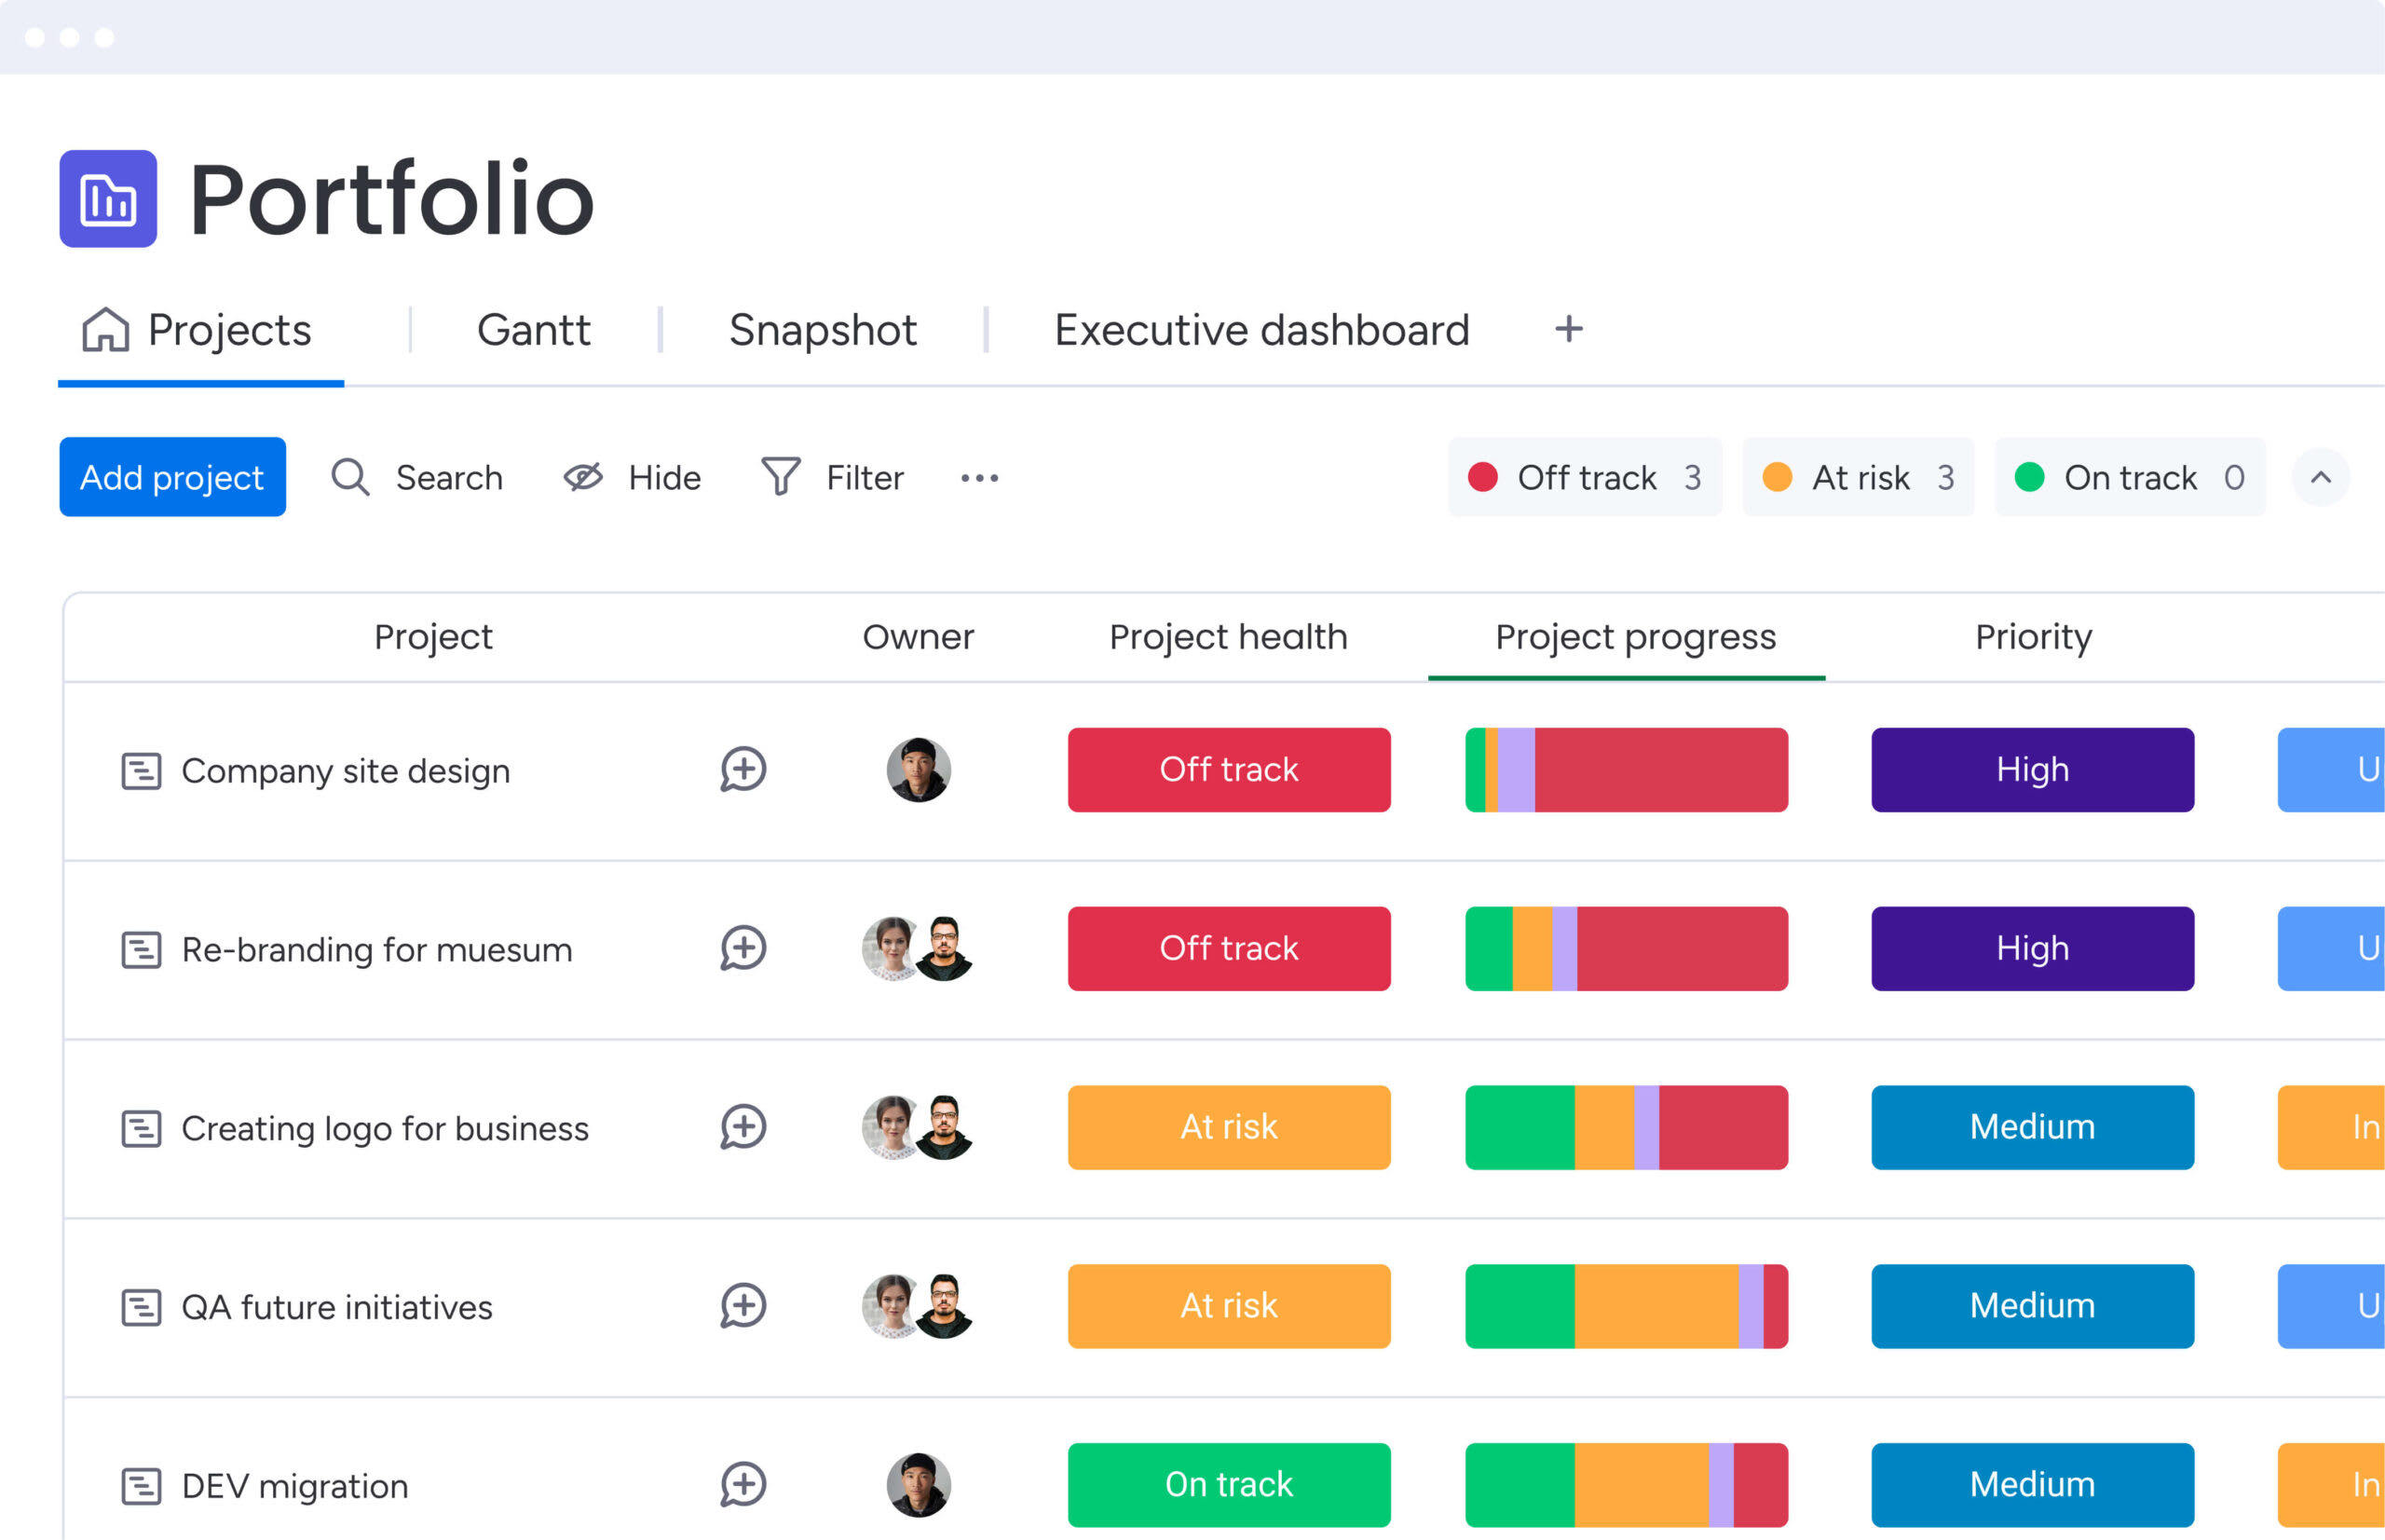
Progress tracking and analytics
Concept maps become far more useful when progress is visible, not assumed. Live data turns visual planning into ongoing execution insight.
Key capabilities include:
- Real-time status indicators: see concepts like “Product launch” update automatically with progress and risk levels.
- Connected analytics widgets: pull live data from linked items to show whether mapped relationships are holding up in practice.
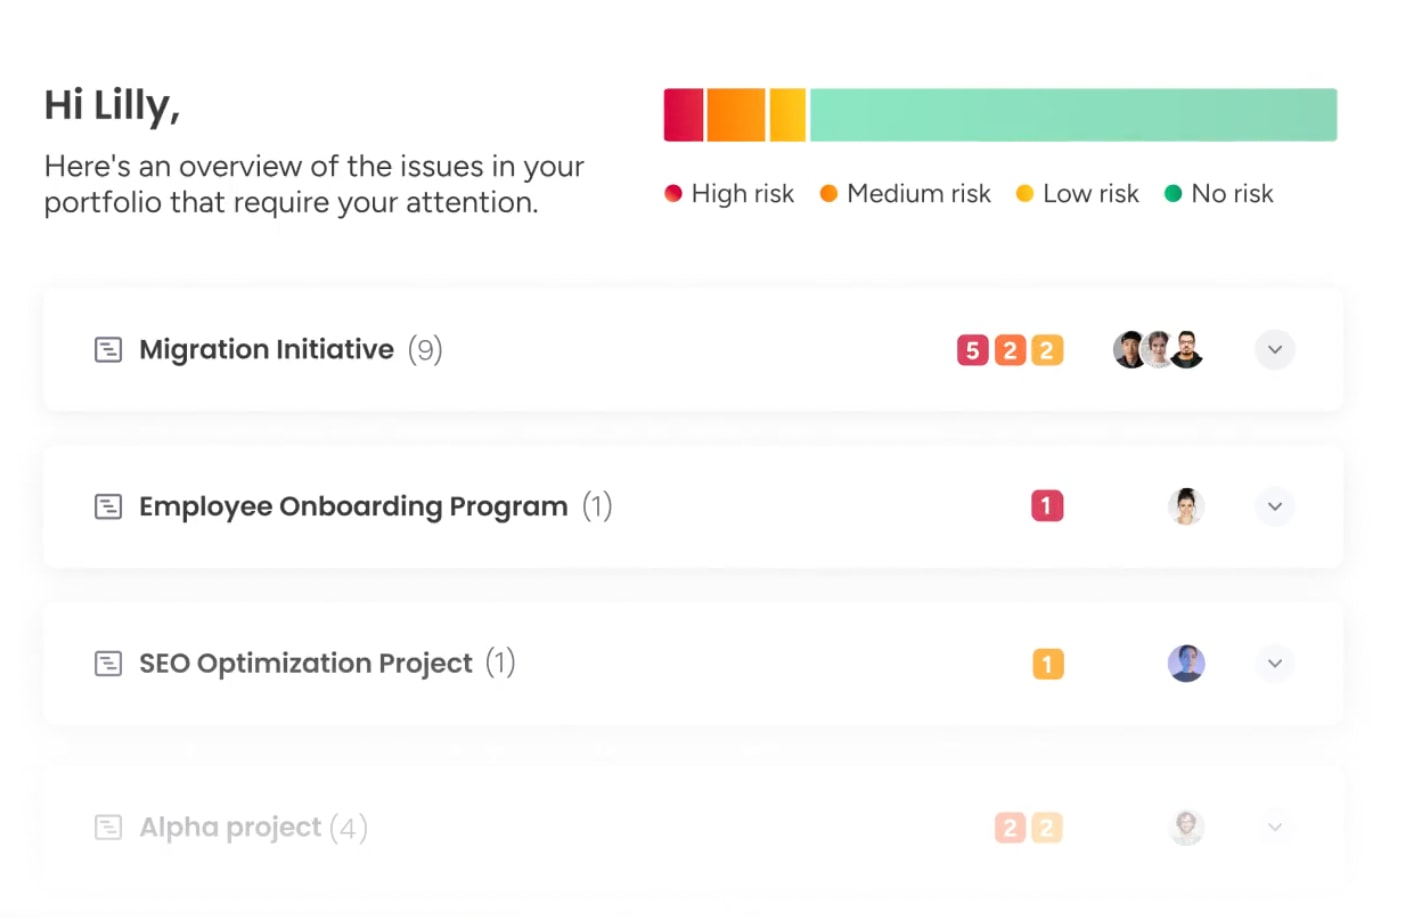
- Early risk detection: Portfolio Risk Insights monitors execution across programs and flags bottlenecks before timelines slip.
This visibility helps leaders move from reviewing static diagrams to managing active work.
AI-powered workflow optimization
AI adds a continuous improvement layer on top of concept maps by learning from execution patterns over time.
How this works in practice:
- Automated bottleneck detection: Digital Workers monitor handoffs and dependencies that stall progress
- Optimization suggestions: recurring slow points trigger recommendations to adjust workflows or dependencies.
- Insight extraction: AI Blocks summarize updates, categorize feedback by urgency, and surface actionable signals from documents.
As execution data feeds back into the map, concept models evolve from planning artifacts into smarter, self-improving systems.
Move from visual thinking to operational excellence
Concept maps have evolved far beyond their origins as learning tools. For mid-to-large organizations managing complex, cross-departmental workflows, they’ve become strategic infrastructure: visual frameworks that create alignment, clarify dependencies, and connect high-level thinking to day-to-day operations.
The value of a concept map isn’t in how it looks on a slide deck either: it’s in what happens next. Traditional mapping tools stop at visualization, but organizations need tools that bridge thinking and doing. They need platforms where nodes become trackable items, relationships drive automations, and maps reflect real-time progress.
Intelligent solutions like monday work management turn concept maps into dynamic workflows that create real results. Your strategic thinking connects directly to execution, automation, and measurement — giving organizations a unified platform where ideas become action.
Frequently asked questions
How long does it take to create a concept map?
Creating a concept map takes 30-60 minutes for simple process maps, while complex strategic planning maps typically require several collaborative sessions spread over a few weeks.
Can you use concept maps for project planning?
Yes, concept maps are highly effective for project planning because they visualize complex dependencies, stakeholder relationships, and resource connections that linear project lists often miss.
What's the difference between concept maps and flowcharts?
Flowcharts visualize a linear sequence of steps and decisions (a process), whereas concept maps visualize a network of relationships between ideas or objects (a system).
Are concept maps more effective than lists?
Concept maps are more effective than lists for understanding complex systems and relationships, though lists remain superior for simple, sequential checklists or inventories.
How do you measure concept map effectiveness?
You can measure a concept map's effectiveness by the outcomes it drives: improved team alignment, faster decision-making, discovery of hidden risks, and successful translation of strategy into execution.
Which concept map software works best for teams?
The best software for teams combines visual mapping capabilities with real-time collaboration, template libraries, and the ability to integrate directly with project execution platforms.