
Data isn’t the issue — visibility is.
Tech teams generate massive amounts of information every day, but when progress updates live in Jira, resource notes sit in spreadsheets, budget details hide in emails, and risks surface only in Slack, project managers are left stitching together a picture that never feels complete.
Dashboard software changes that dynamic entirely. By turning scattered inputs into real-time, unified visibility, it gives project managers (PMs) a single place to understand project health, spot delays, track resources, and see how every initiative fits into the bigger picture. No more manual reporting. No more guesswork. Just clarity when it counts.
And that’s exactly what you’ll take away here: how modern dashboards work, which capabilities matter most for tech organizations, how leading platforms compare, and how teams use dashboards to elevate decision-making, accelerate delivery, and eliminate reporting chaos. You’ll walk away knowing what separates true enterprise dashboard solutions from basic visualization tools—and how to pick the one that actually moves the needle for your team.
Key takeaways
Before exploring the platforms and features shaping next-generation project visibility, here are the essential points every tech PM should take with them:
- Unified project visibility: bring data from Jira, Slack, GitHub, spreadsheets, and financial tools into one real-time view.
- Role-specific insights: tailor dashboards for executives, PMs, team leads, and clients so everyone sees exactly what matters.
- Automated reporting: eliminate manual status updates with dashboards that refresh automatically as work progresses.
- Integrated workflows with monday work management: access dashboards connected directly to live workflows — no syncing, no extra maintenance.
- AI-powered foresight: detect risks, resource conflicts, and budget issues early with intelligent alerts and predictive insights.
Understanding dashboard software for enterprise visibility
In simple terms, dashboard software pulls all your scattered data together into visual displays you can actually use — giving you the real-time insights needed to make confident decisions. For project managers in tech dealing with fragmented workflows and scattered information, this solutions transforms raw data into actionable insights through customizable charts, graphs, and metrics that update automatically. Leveraging a project management dashboard further centralizes data for immediate visibility.
The right dashboard software is more than just a collection of charts; it’s a command hub that brings your entire operation into focus. Teams gain instant visibility into project health, resource allocation, and performance metrics, with all updates centralized in one place.
This centralized approach frees up those hours you’ve been wasting on manual reports, while giving stakeholders direct access to the latest information.
Why project managers in tech need specialized dashboard solutions
Tech project managers face unique challenges that generic reporting tools can’t address. Work happens across multiple disconnected platforms, creating visibility gaps that impact decision-making and project outcomes.
Work happens across Jira for development, Slack for communication, spreadsheets for planning, and multiple other platforms for documentation and approvals. This fragmentation creates blind spots that delay decisions and obscure risks until they become critical issues.
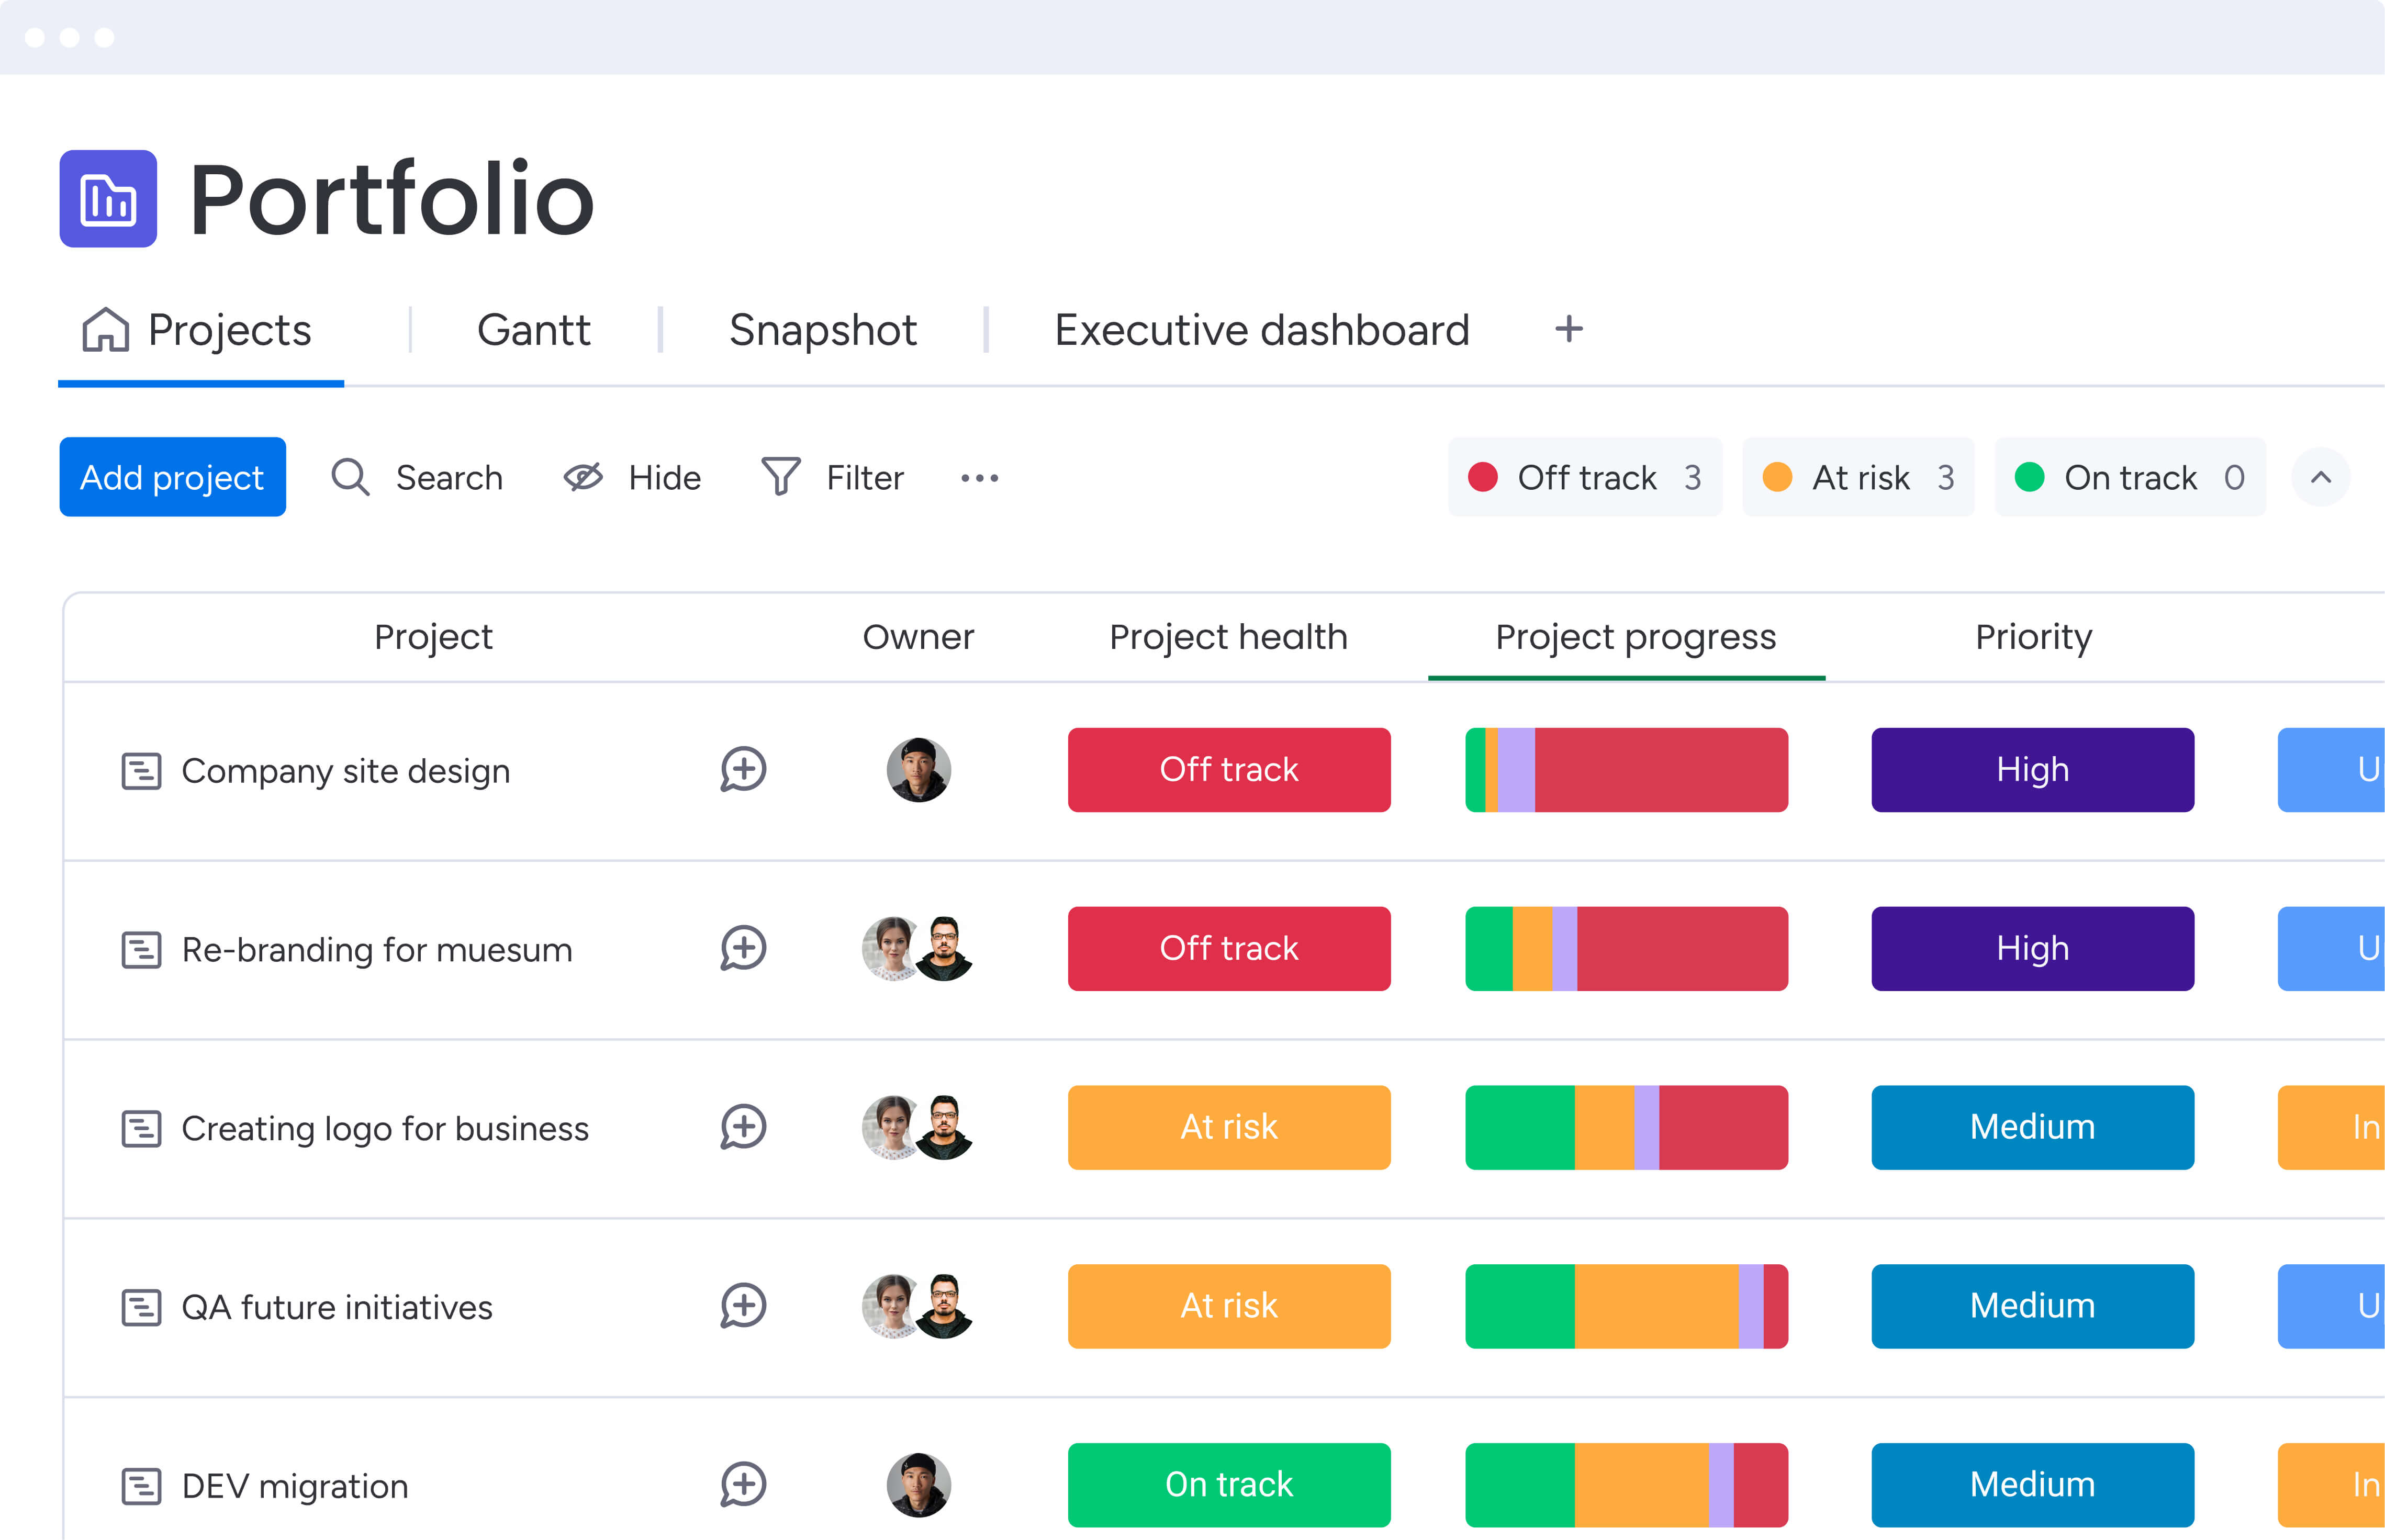
Things get exponentially harder when you’re juggling several projects at once. Each project has different stakeholders who need specific views — executives want portfolio-level insights often best served by an executive dashboard, team leads need granular task tracking, and clients expect regular progress updates. Creating separate reports for each audience becomes a full-time job that pulls project managers away from strategic work.
Specialized dashboard software addresses these pain points by providing a unified view of your entire project landscape. These platforms are built with several key capabilities that empower project managers:
- Real-time data synchronization: information flows automatically between connected tools.
- Customizable views: each stakeholder sees relevant metrics without information overload.
- Automated reporting: scheduled updates and alerts eliminate manual status meetings.
- Cross-project visibility: portfolio dashboards reveal dependencies and resource conflicts.
Essential features for enterprise dashboard software
When evaluating software for enterprise teams and PMOs, certain capabilities separate professional-grade platforms from basic visualization tools. These features directly impact your ability to manage complex projects and deliver reliable insights to stakeholders. Understanding what to prioritize helps you select a platform that scales with your organization’s needs.
Customizable dashboards and reporting capabilities
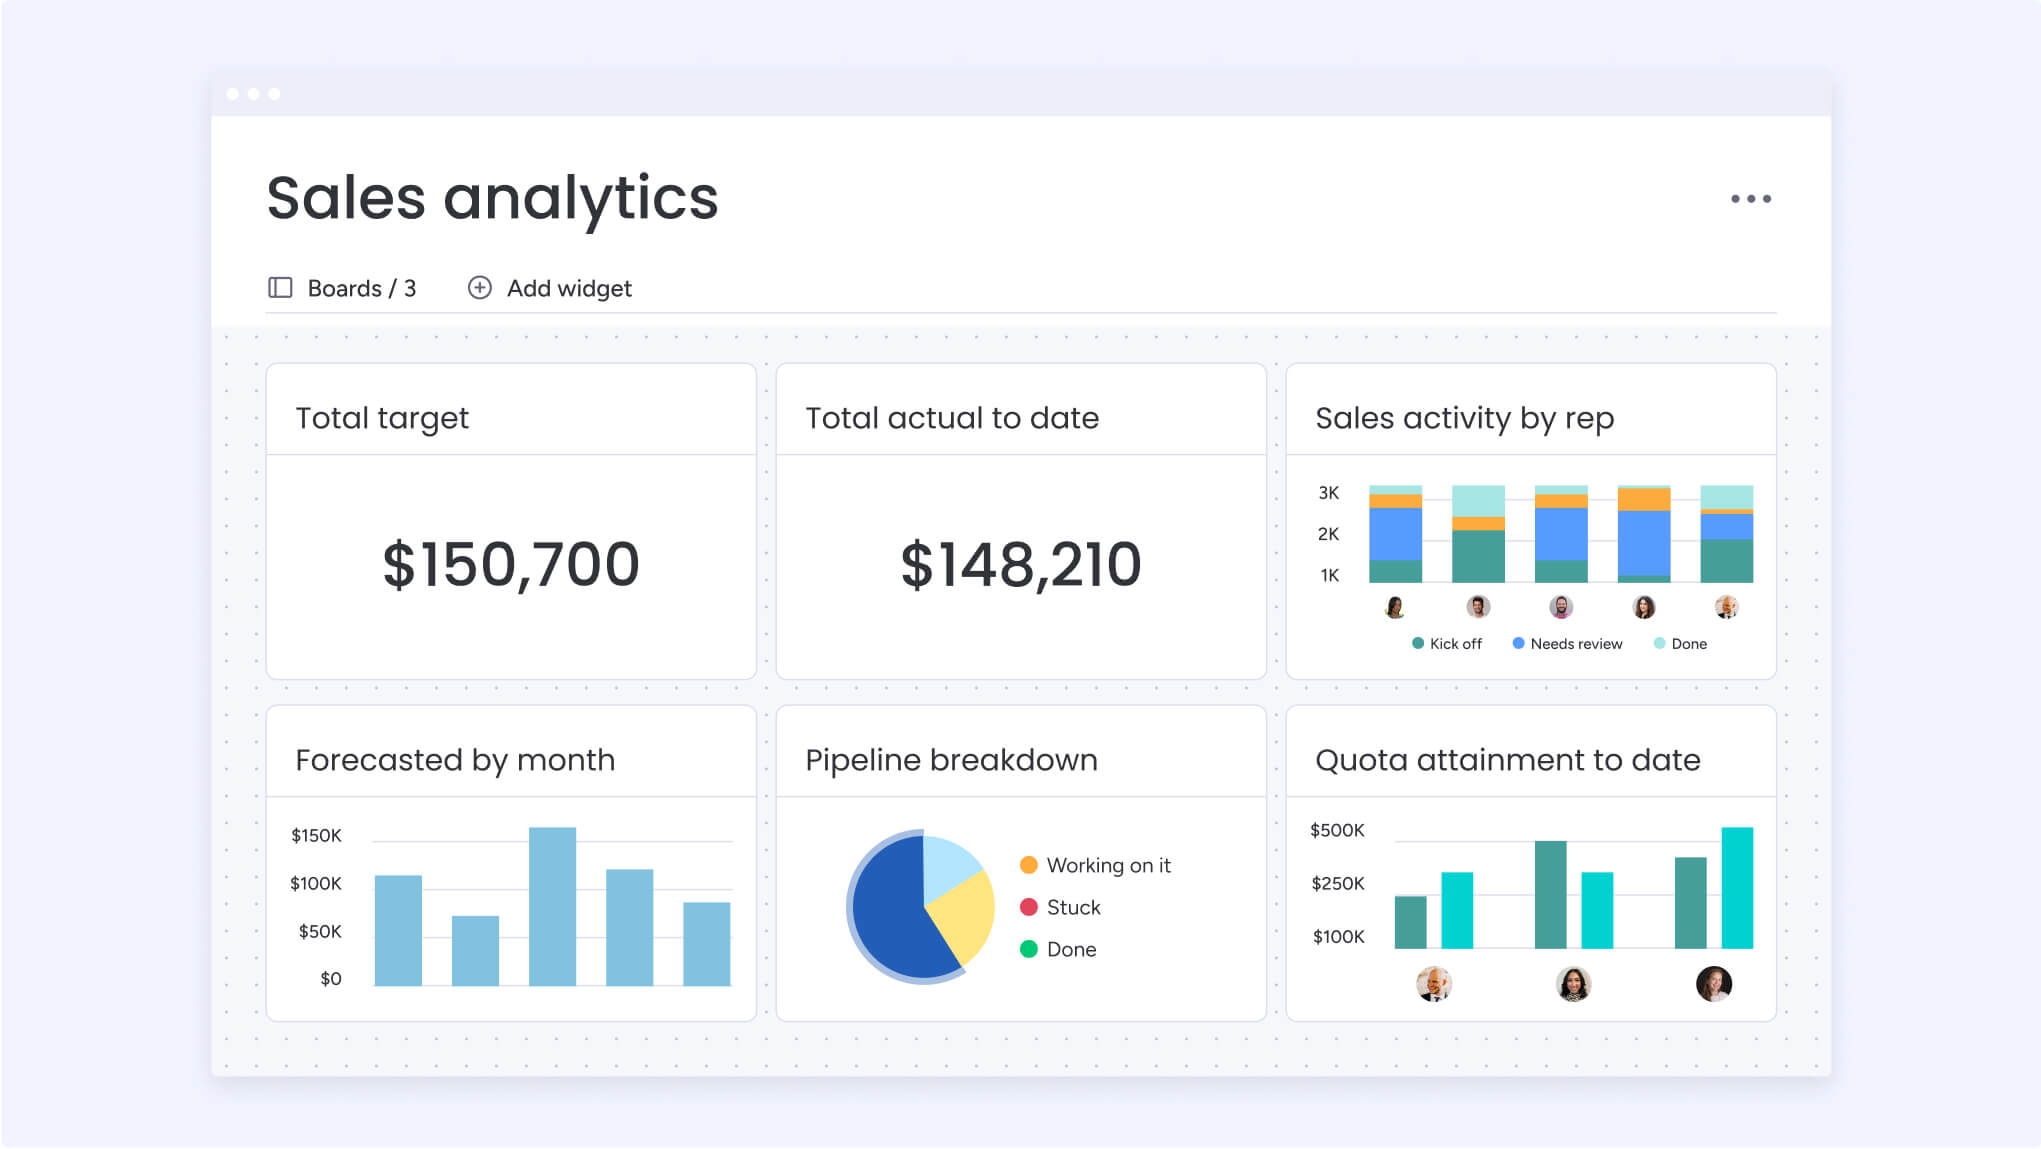
Your enterprise team doesn’t work like everyone else’s, so you need dashboards you can tailor to your unique workflows and metrics. The most effective platforms provide drag-and-drop builders with diverse widget types — from Gantt charts and burndown graphs to custom KPI trackers and resource heatmaps.
Key customization features include:
- Widget variety: 30+ visualization options for different data types.
- Multiple dashboard views: separate interfaces for executives, managers, and team members.
- Custom metrics: formula builders for unique KPIs and calculations.
- Branding options: consistent visual identity across all reports.
Portfolio management and multi-project visibility
Got the hang of managing single projects? Great — now multiply that by 20. Enterprise PMOs need portfolio dashboards that give them visibility across all initiatives at once. This bird’s-eye view reveals patterns and risks that project-level reporting misses.
Portfolio management features should include:
- Cross-project dependencies: visual mapping of interconnected tasks and milestones.
- Resource allocation views: see who’s overloaded and who has capacity.
- Budget tracking: monitor spending across all projects simultaneously.
- Strategic alignment: connect projects to organizational goals and OKRs.
Integration depth with existing tech stacks
Effective dashboard software is only valuable if it connects to where your team actually works. Native integrations with development tools, communication platforms, and business systems ensure data flows automatically without manual updates.
Critical integration capabilities:
- Development tools: Jira, GitHub, GitLab for engineering metrics.
- Communication: slack, Microsoft Teams for collaboration context.
- Business systems: ERP, CRM, and financial platforms for complete visibility.
- API access: Custom connections for proprietary tools.
How monday work management transforms dashboard capabilities
monday work management flips the script by embedding dashboards directly into your workflow, right where the actual work happens. Instead of adding another disconnected reporting platform, teams get real-time visibility within their existing workflows. This integrated approach eliminates data silos and provides instant insights without switching between multiple systems.
The platform’s dashboard capabilities focus on three core pillars that address enterprise needs:
- Leadership visibility: surfaces critical insights through AI-powered risk detection and portfolio reports. The system automatically scans project updates to identify potential delays, resource conflicts, and budget concerns before they escalate. Executive dashboards can track hundreds of projects simultaneously while maintaining performance.
- Standardization and alignment: ensures consistency across departments through managed templates and cross-project dependencies. When processes change, updates cascade automatically to all related workflows. This governance layer maintains control without sacrificing team flexibility.
- Resource optimization: provides complete visibility into team capacity through the resource directory and capacity manager. Project managers can see skills, availability, and workload distribution across the entire organization, making informed decisions about task assignments and timeline adjustments.
These capabilities integrate seamlessly because they’re built into the same platform teams use for daily work. There’s no data syncing delay or integration maintenance — dashboards reflect live information as work progresses.
Comparing dashboard software platforms
Let’s compare how these platforms handle dashboards so you can find the right match for your team’s specific needs. Each platform has distinct strengths and limitations that impact long-term scalability and user adoption.
| Feature | monday work management | Asana | Jira | Smartsheet |
|---|---|---|---|---|
| Dashboard customization | 30+ widget types with drag-and-drop builder | Limited widget options | Developer-focused metrics | Spreadsheet-based views |
| Portfolio management | Native with AI risk insights | Requires premium tier | Third-party add-ons needed | Available on higher plans |
| Real-time updates | Instant synchronization | Delayed refresh cycles | Manual refresh required | Periodic updates |
| Integration breadth | 200+ native connectors | 200+ integrations | Atlassian ecosystem focus | 100+ connections |
| Mobile functionality | Full feature parity | Limited mobile dashboards | Basic mobile views | Restricted mobile access |
| Scalability | Handles 1,000+ projects | Performance degrades at scale | Requires optimization | Limited by spreadsheet model |
Implementation strategies for dashboard software
Getting dashboard software right isn’t just about the technical setup. You need a smart rollout plan that builds momentum without throwing your team into chaos. These four steps ensure your team adopts the new system and realizes measurable value quickly.
Step 1: map your data landscape
Start by mapping out where all your project data actually lives right now. Identify primary sources like task management tools, time tracking systems, and communication platforms. Note which metrics matter most to different stakeholders and where that information originates.
This mapping exercise reveals integration priorities and highlights data gaps that need addressing. It also helps identify quick wins — simple dashboards that deliver immediate value while building toward more complex implementations.
Step 2: design stakeholder-specific views
Different roles need different information presented in different ways. Start by creating distinct dashboard templates for key user groups:
- Executive dashboards: high-level portfolio health, strategic alignment, risk indicators.
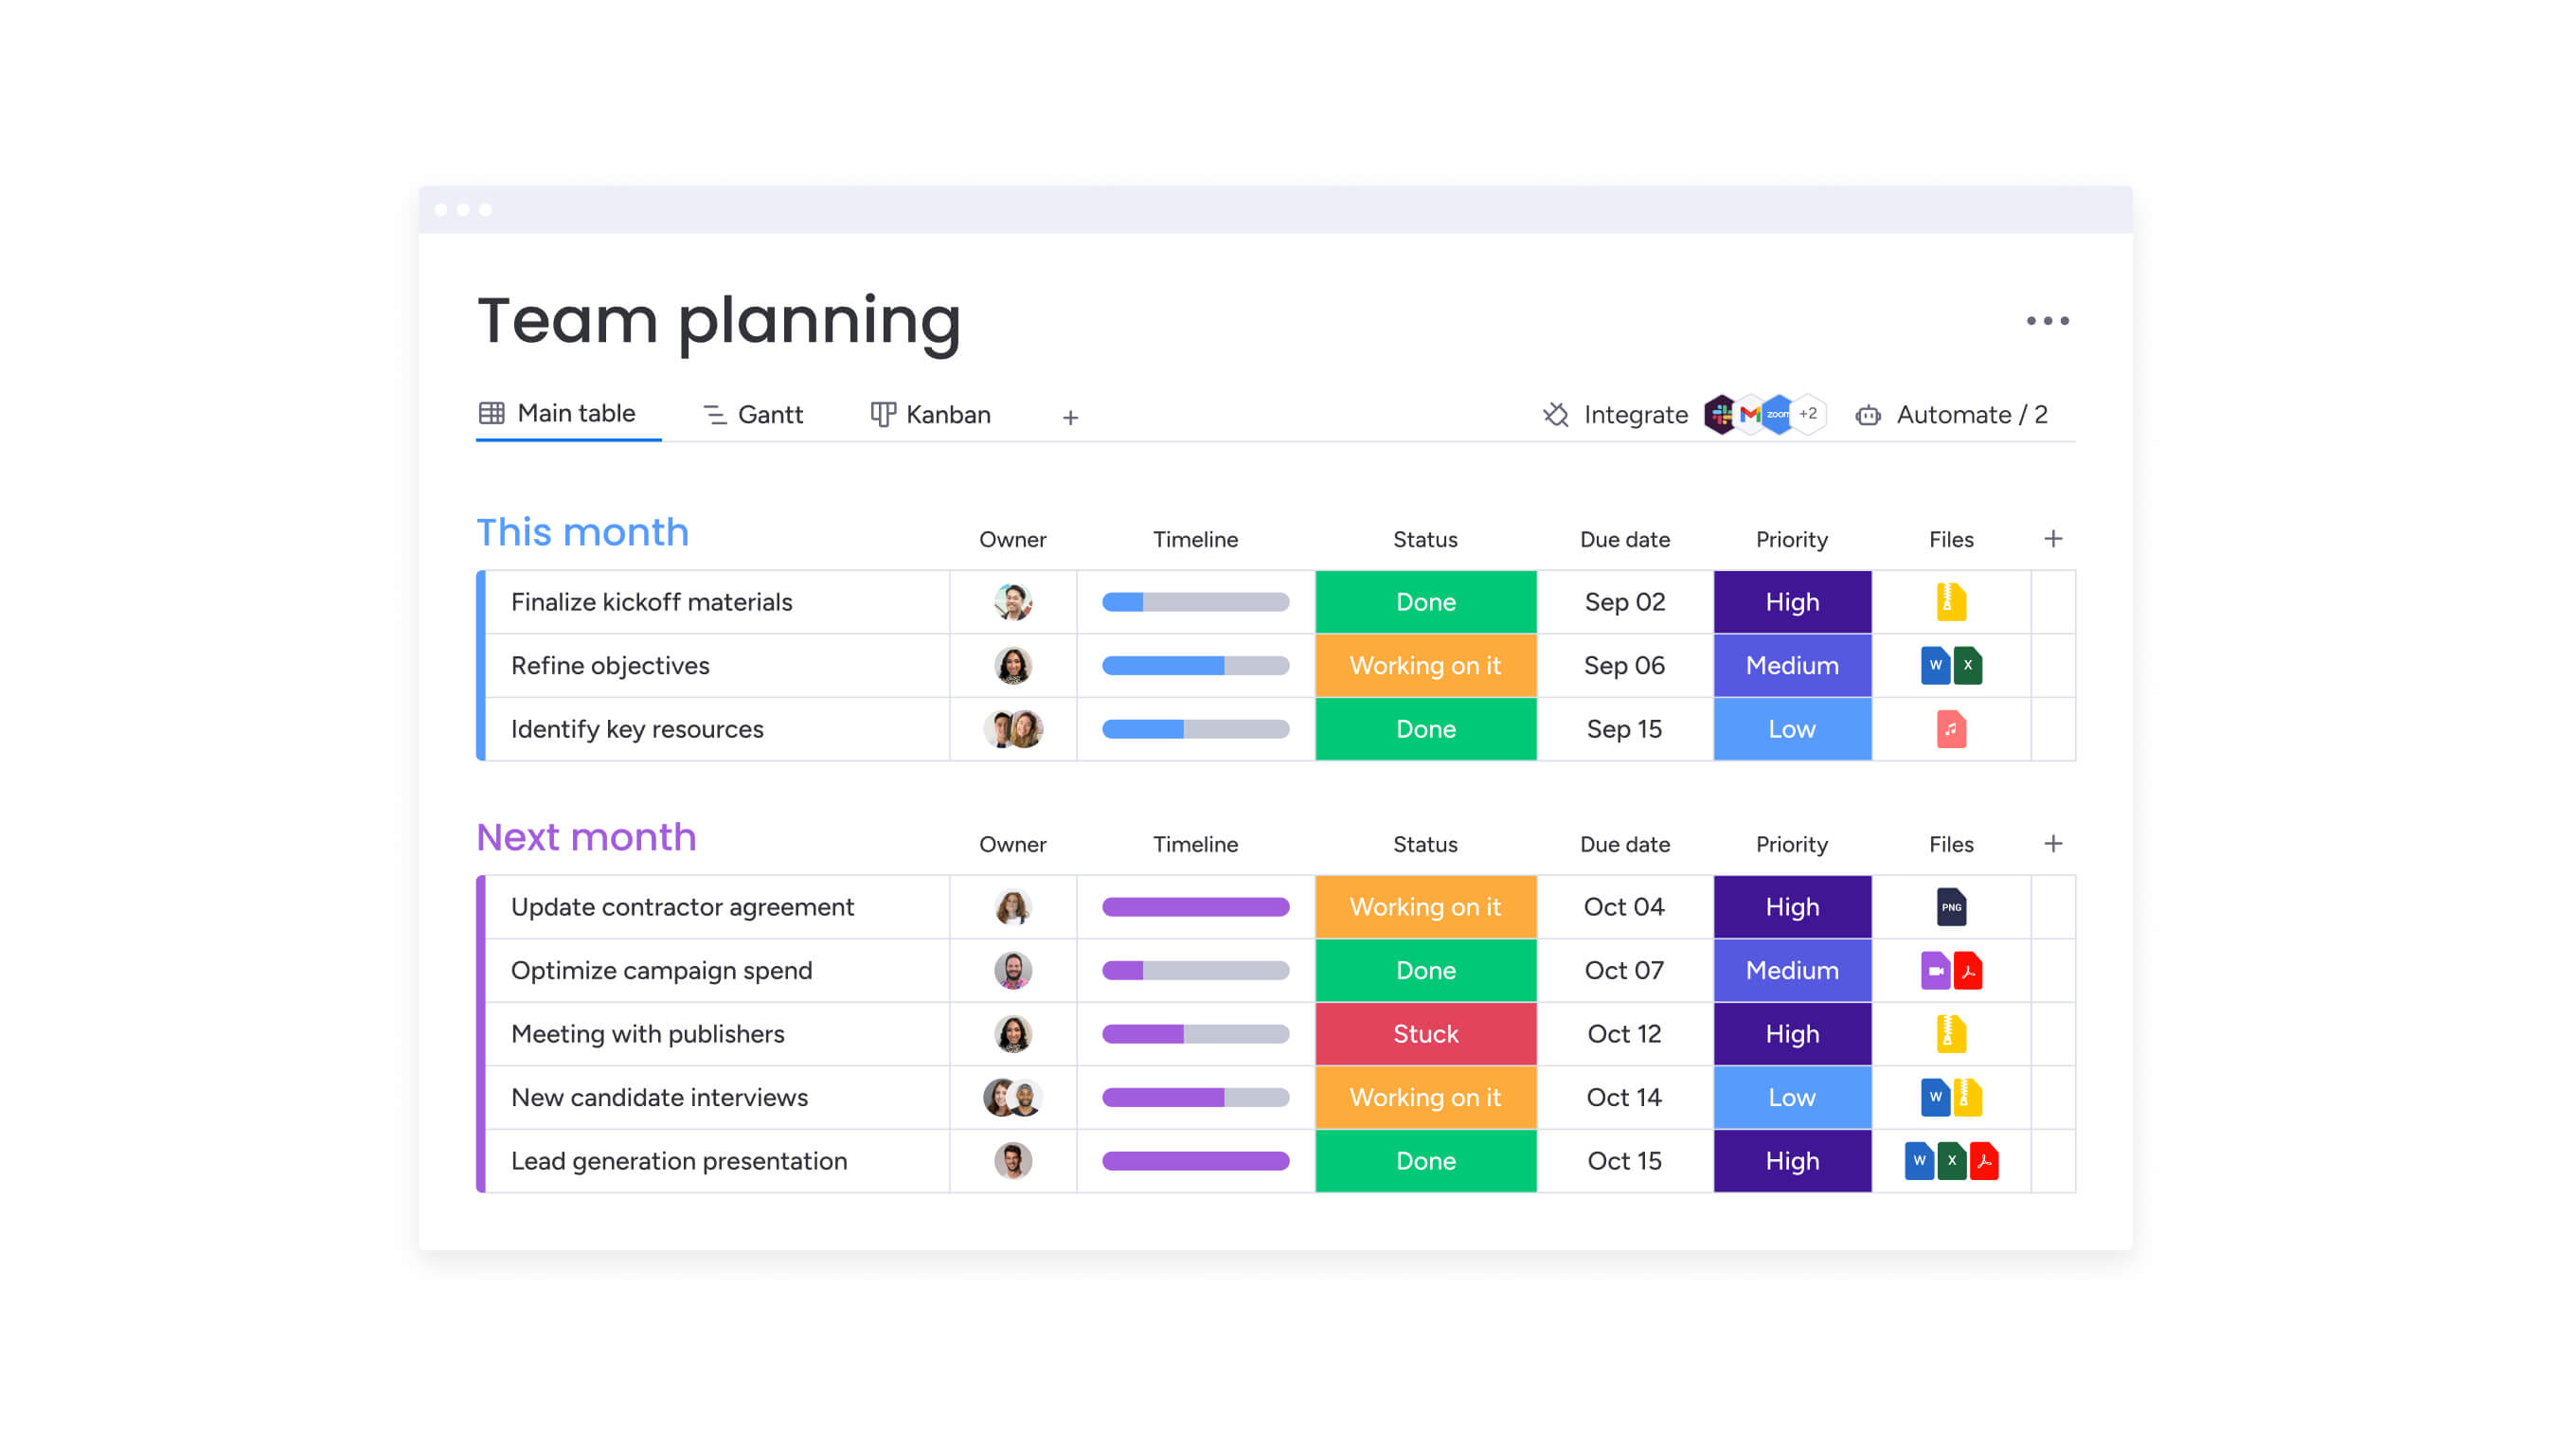
- Manager dashboards: team performance, workload distribution, project timelines.
- Team dashboards: task assignments, sprint progress, blockers and dependencies.
Each view should answer specific questions that group typically asks, eliminating the need for status meetings and email updates.
Step 3: establish data governance
Consistent, reliable dashboards require clean, standardized data. Define naming conventions, required fields, and update frequencies. Assign ownership for data quality and create processes for regular validation.
Governance also includes access controls — determining who can view, edit, and share different dashboards. This ensures sensitive information remains protected while enabling appropriate transparency.
Step 4: automate and iterate
Once basic dashboards are running, add automation to reduce manual work. Set up scheduled reports, threshold alerts, and status change notifications. Use feedback from users to refine visualizations and add new metrics as needs evolve.
Regular iteration keeps dashboards relevant and valuable. What matters in Q1 might change by Q3, so build flexibility into your dashboard strategy from the start.
Measuring dashboard software success
When you get dashboards right, you’ll see concrete improvements you can actually measure. Track these indicators to validate your investment and identify optimization opportunities. These metrics help demonstrate ROI to stakeholders and guide future enhancements.
- Time savings: represents the most immediate return. Teams typically save 3+ hours weekly by eliminating manual report creation and status meetings. This recovered time can be redirected to strategic planning and problem-solving.
- Decision velocity: improves when stakeholders have instant access to current information. Measure how quickly teams identify and respond to issues compared to pre-dashboard baselines.
- Data accuracy: increases through automated collection and standardized processes. Track error rates and discrepancies between different reporting sources.
- User adoption: indicates whether dashboards deliver real value. Monitor login frequency, dashboard views, and feature usage to ensure teams actively engage with the platform.
- Project outcomes: ultimately validate dashboard effectiveness. Look for improvements in on-time delivery rates, budget adherence, and stakeholder satisfaction scores.
Advanced dashboard capabilities with AI and automation
The best dashboard platforms now use AI to do much more than just show you static reports. With these smart features, your dashboards stop being just pretty charts and start actively helping you manage work. AI capabilities help teams anticipate problems and optimize resources before issues impact project delivery.
AI-powered capabilities in monday work management include:
- Risk prediction: algorithms analyze project patterns to flag potential delays before they occur.
- Resource recommendations: AI suggests optimal task assignments based on skills and availability.
- Automated insights: natural language summaries explain what metrics mean and what actions to take.
- Anomaly detection: unusual patterns trigger alerts for immediate investigation.
Automation further enhances dashboard value by maintaining data freshness without manual intervention. Status updates flow automatically from task completions, time entries sync from tracking tools, and reports generate on predetermined schedules.
These intelligent features are particularly valuable for PMOs managing large portfolios. Instead of manually reviewing hundreds of projects for risks, AI surfaces the critical issues that need attention. This proactive approach prevents small problems from becoming major crises.
Transform your project visibility with intelligent dashboards
Dashboard software has evolved far beyond basic reporting. Today’s platforms provide the complete visibility required to make informed decisions and accelerate progress. For project managers in tech dealing with scattered work and complex stakeholder needs, the right dashboard solution consolidates chaos into a unified, actionable view.
The most effective platforms, like monday work management, combine customization flexibility with enterprise governance, enabling teams to build exactly what they need while maintaining organizational standards. When dashboards connect directly to where work happens, they eliminate the friction between doing work and understanding its impact.
monday work management exemplifies this integrated approach, bringing together customizable dashboards, AI-powered insights, and seamless workflow integration. By embedding visibility directly into work management, teams spend less time reporting and more time delivering results that matter.
The content in this article is provided for informational purposes only and, to the best of monday.com’s knowledge, the information provided in this article is accurate and up-to-date at the time of publication. That said, monday.com encourages readers to verify all information directly.
Frequently asked questions
How long does it take to implement dashboard software in a tech organization?
Implementation typically takes two to four weeks for basic setup and initial dashboards. Most teams achieve full deployment within one to two months, including integrations, customization, and team training. The timeline depends on your organization's size and complexity.
Can dashboard software integrate with both Agile and Waterfall project methodologies?
Yes, flexible dashboard platforms support hybrid approaches. You can create sprint burndown charts for Agile teams while maintaining Gantt views for Waterfall projects, all within the same portfolio dashboard.
What security features should enterprise dashboard software include?
Enterprise dashboard software requires SOC 2 compliance, role-based access controls, audit trails, and encryption. Additional features like SSO, IP restrictions, and GDPR compliance are essential for organizations handling sensitive data.
How do you calculate ROI for dashboard software investments?
Calculate ROI by measuring time saved on reporting, reduction in project delays, and improved resource utilization. Most organizations see 2-3x ROI within six months through efficiency gains and better decision-making.
What's the difference between dashboard software and business intelligence platforms?
Dashboard software focuses on operational metrics and real-time project tracking, while BI platforms analyze historical data for strategic insights. Many organizations use both, with dashboards for daily management and BI for long-term planning.
How many projects can enterprise dashboard software typically handle?
Enterprise-grade platforms like monday work management can handle 1,000+ active projects without performance degradation. The key is choosing software with proven scalability and efficient data architecture.