
Marketing teams today manage campaigns across 15–20 platforms, from Google Ads and Meta to email automation and CRM systems. With performance data scattered across multiple tools, it’s difficult to get a complete picture of what’s working. This fragmentation leads to reactive decisions rather than strategic moves guided by comprehensive insights.
Dashboard software solves this problem by centralizing data into unified, real-time views. Instead of manually switching between platforms, marketing leaders can see all campaigns in one place, track performance trends, and act on insights immediately. For complex marketing operations, the right dashboards turn scattered data into a command center for informed decision-making.
The most effective platforms do more than display metrics too, they link insights directly to action. Real-time updates, predictive analytics, and automated alerts ensure teams catch opportunities and address issues before they impact results. By connecting data with workflows, these tools help marketing leaders move from reactive reporting to proactive campaign management.
Key takeaways
Marketing dashboard software helps marketing leaders turn scattered data into actionable insights. Here are the essential points to keep in mind when evaluating and implementing a dashboard solution:
- Centralized visibility: consolidate marketing data from multiple platforms into a single view to make faster, smarter decisions.
- Real-time insights: dashboards should reflect live campaign performance, enabling teams to act on opportunities or issues immediately.
- Actionable intelligence: the best solutions connect data to workflows, allowing managers to link insights directly to campaign execution.
- Work management integration: platforms like monday work management combine dashboards with task and project management, helping teams align insights with execution.
- AI and automation support: advanced dashboards leverage AI to predict trends, flag risks, and automate reporting, helping teams focus on strategy over manual data management.
What makes dashboard software essential for marketing teams?
Dashboard software consolidates scattered data into visual displays that reveal what is truly working. Instead of raw numbers buried across multiple platforms, marketing leaders gain actionable insights that show the story behind each campaign.
For marketing teams of 50+ people, fragmentation is a real challenge: Google Ads data sits in one place, social metrics are in Meta, and email results exist elsewhere. Without a unified view, decisions are made in the dark.
Strong dashboard platforms consolidate these sources into a single location. Exceptional platforms take it further by connecting insights to action. When a campaign underperforms, teams can adjust budgets or messaging immediately, no need to toggle across multiple systems. This distinction defines the difference between possessing data and leveraging it effectively.
Dashboard software vs business intelligence platforms: understanding the difference
Dashboard software and business intelligence (BI) platforms may appear similar but serve distinct purposes.
Dashboard software is designed for daily operations. It aggregates data in real-time, providing managers and teams with insights for immediate decision-making. No specialized skills or data science expertise are required, teams can create views, share dashboards, and collaborate efficiently.
BI platforms, in contrast, are built for analysts performing deep data exploration. They offer sophisticated modeling and uncover hidden trends but require a learning curve and, often, SQL knowledge.
Here’s how they compare in practice:
| Aspect | Dashboard software | Business intelligence tools |
|---|---|---|
| Primary users | Managers, team leads, executives | Data analysts, business analysts |
| Setup complexity | Low to medium | High |
| Real-time updates | Yes, automatic | Often requires manual refresh |
| Integration focus | Operational tools and platforms | Data warehouses and databases |
| Customization | Drag-and-drop, no coding | Often requires SQL or scripting |
| Best for | Daily monitoring and quick decisions | Deep analysis and trend discovery |
For marketing organizations that need both visibility and action, dashboard software often provides the right balance of power and usability.
Essential features that define powerful dashboard software
.jpg)
Not all dashboard platforms deliver the same value. The best solutions combine data visibility with actionable workflows.
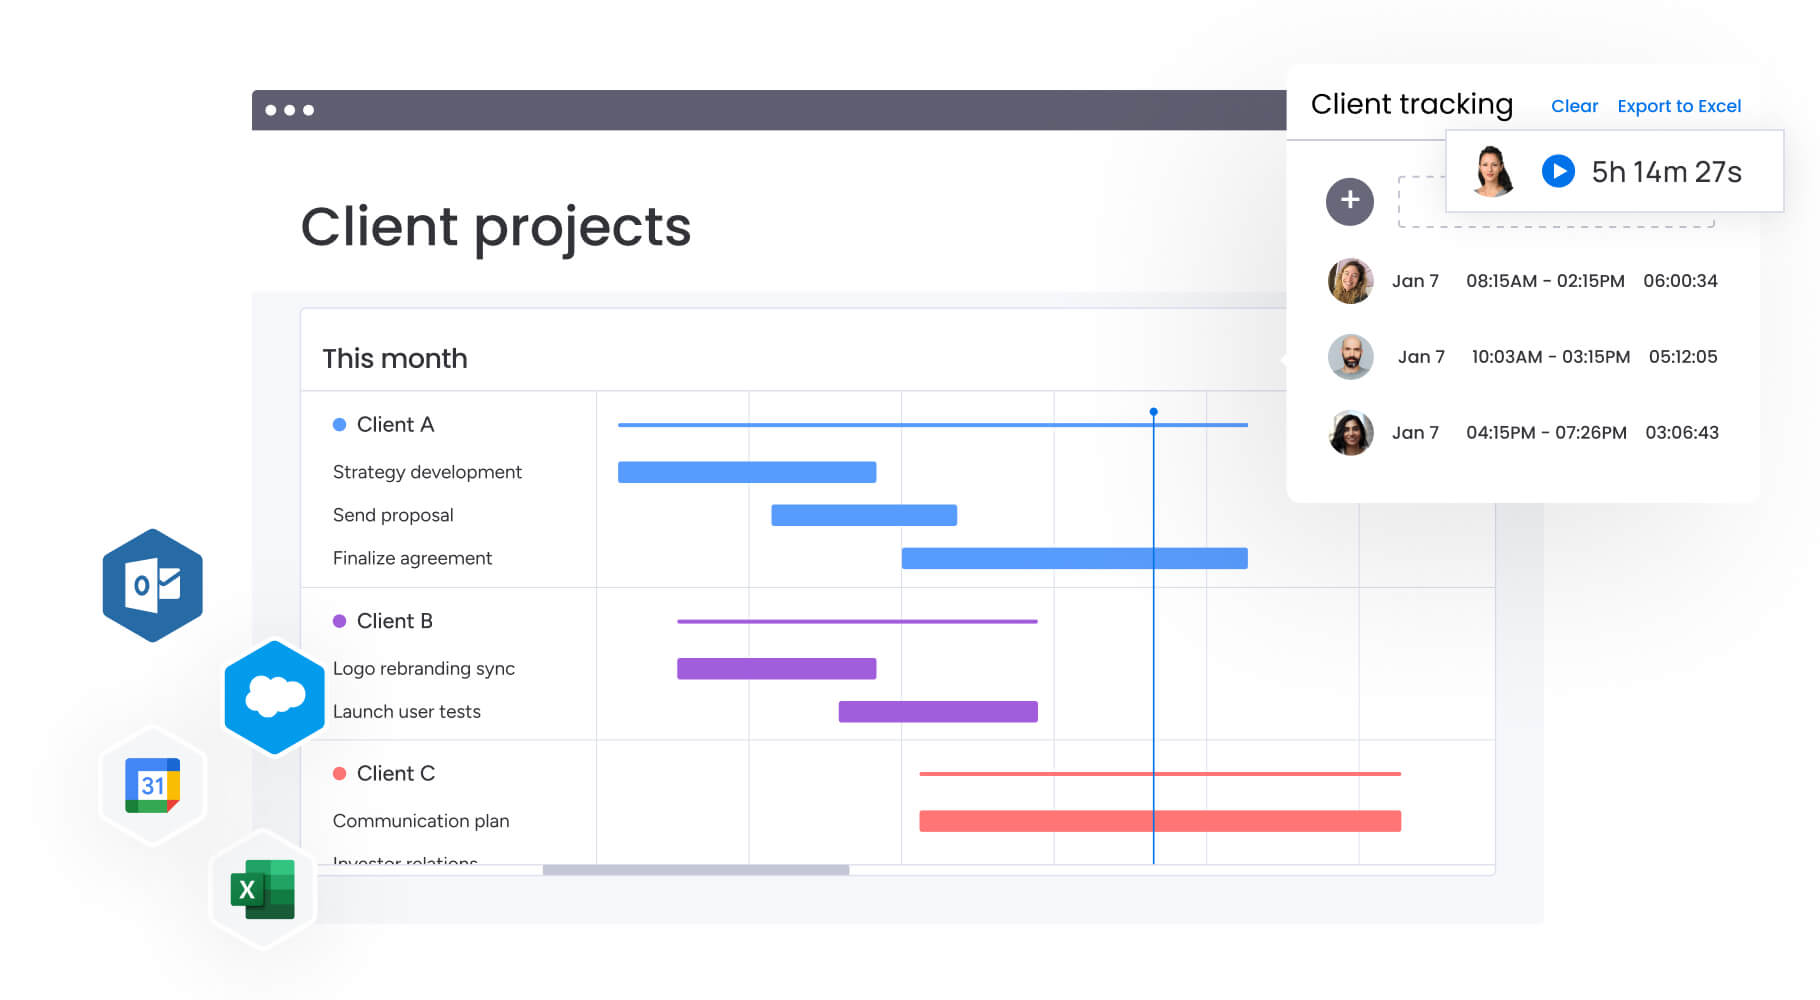
Real-time data synchronization
When a campaign starts underperforming, immediate visibility is critical. Waiting for spreadsheet updates delays decisions and limits opportunities. Real-time dashboards provide minute-by-minute insight into leads, conversions, and campaign activity.
Imagine noticing that your Facebook campaign is suddenly generating twice the clicks at half the cost. With real-time data, budget can be reallocated instantly from underperforming channels to maximize performance. Without this visibility, valuable opportunities may pass unnoticed, discovered only days later.
Comprehensive integration capabilities
Marketing stacks today often resemble complex technology ecosystems. Each platform serves a purpose, but disconnected systems create blind spots and inefficiencies.
Native integrations: platforms like Google Ads, Meta Business, Salesforce, HubSpot, and marketing automation tools should connect without manual data transfers.
API flexibility: as your tech stack evolves, you need a dashboard platform that can adapt without requiring developer resources for every new connection.
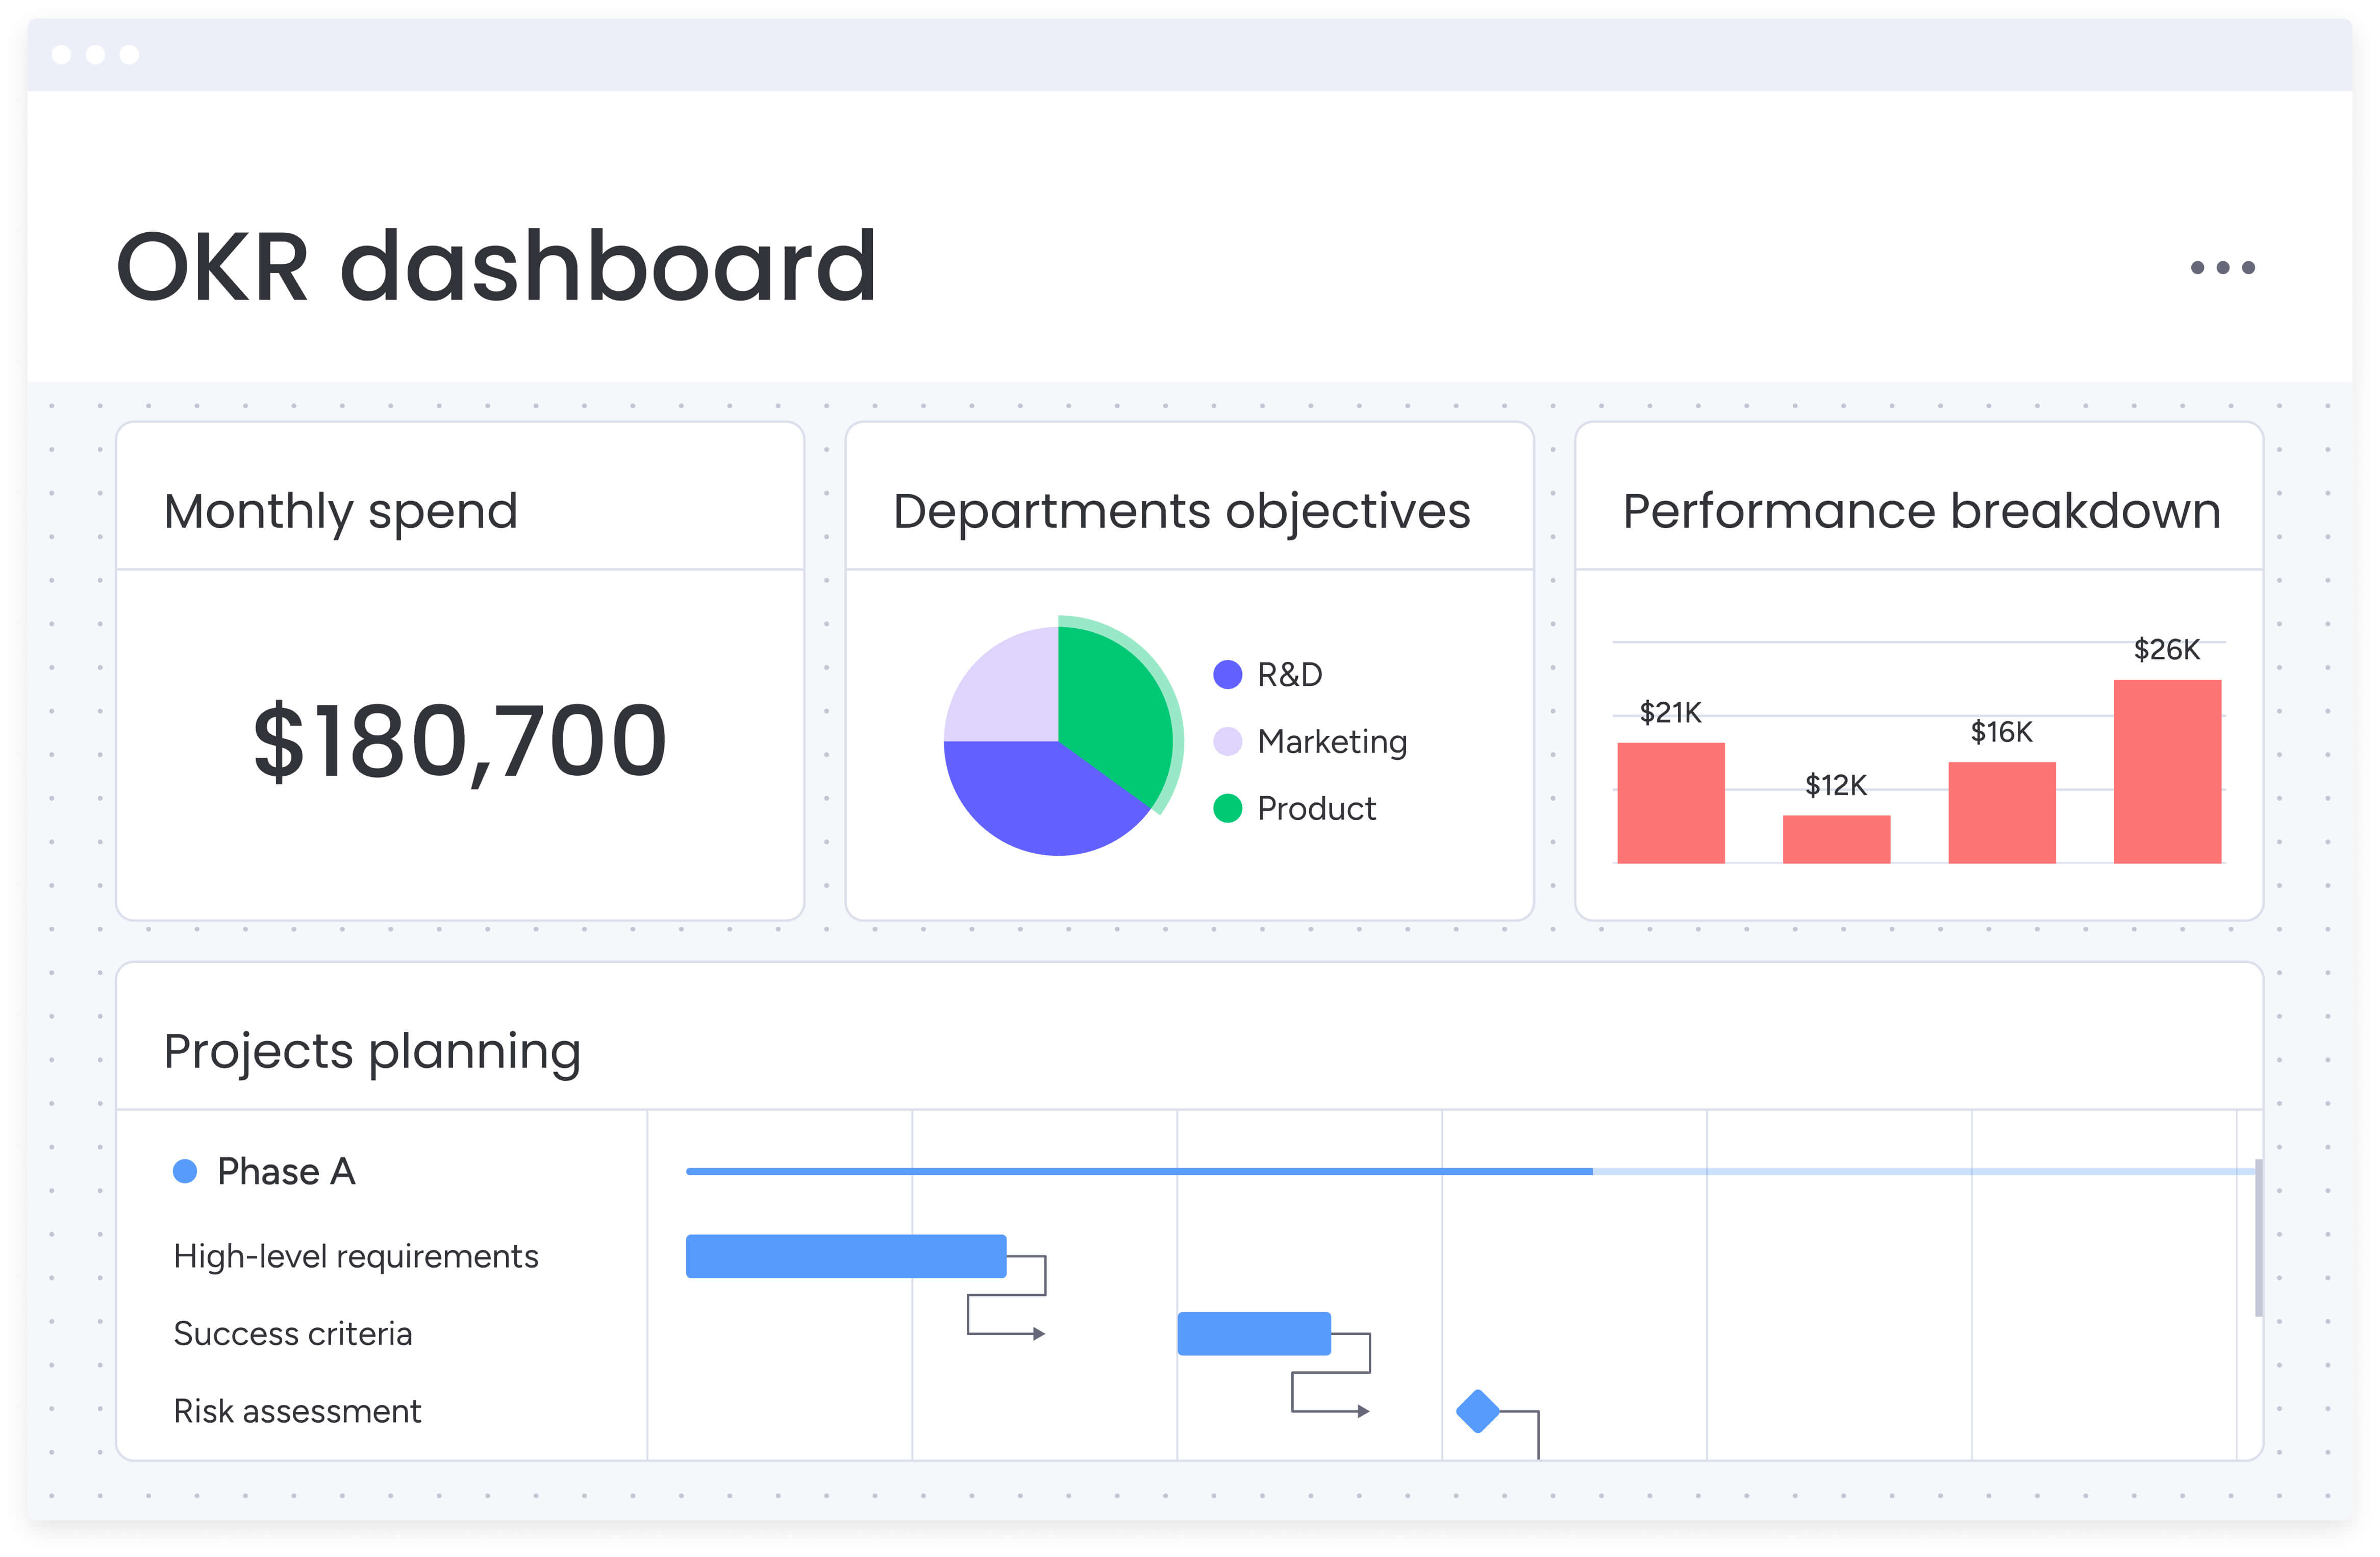
Customization without complexity
Different stakeholders require different perspectives. The right platform enables tailored dashboards for each role without IT intervention.
Executive dashboards: high-level KPIs and trend analysis for leadership decisions.
Campaign manager views: granular performance metrics for optimization and tactical adjustments.
Team lead dashboards: capacity and workload distribution for resource management.
Drag-and-drop interfaces, pre-built templates, and visual builders make customization accessible to everyone, not just data specialists.
Automation and intelligent alerts
Manual reporting drains hours from your week. Dashboard software should automate routine tasks like report generation, stakeholder updates, and performance alerts.
Set thresholds for key metrics and receive notifications when:
- Campaigns exceed budgets.
- Conversion rates drop below targets.
- Team capacity reaches critical levels.
Automation extends further by triggering workflows based on dashboard data, reallocating resources when workloads spike or pausing underperforming campaigns automatically.
How AI transforms dashboard software capabilities
AI elevates dashboards from reactive reports to proactive advisors. Instead of merely showing that email open rates dropped, AI-driven platforms can identify causes and recommend adjustments before the next campaign launches.
This shift moves teams from firefighting past issues to preventing future problems. Dashboards act less like reports and more like intelligent team members.
AI-powered features include:
- Risk identification: algorithms scan project data to flag potential delays or budget overruns before they occur.
- Automated insights: AI summarizes complex data into plain-language explanations and recommendations.
- Predictive forecasting: machine learning models project future performance based on current trends.
- Smart categorization: automatically organize and tag data for more accurate reporting.
These capabilities are particularly valuable for marketing teams managing multiple campaigns across channels. AI can identify which campaigns are likely to underperform, suggest budget reallocations, and even recommend optimal timing for launches based on historical patterns.
Best dashboard software for marketing teams
Choosing the right dashboard software depends on your team’s specific needs, technical expertise, and integration requirements. Here’s how leading platforms compare for marketing organizations.
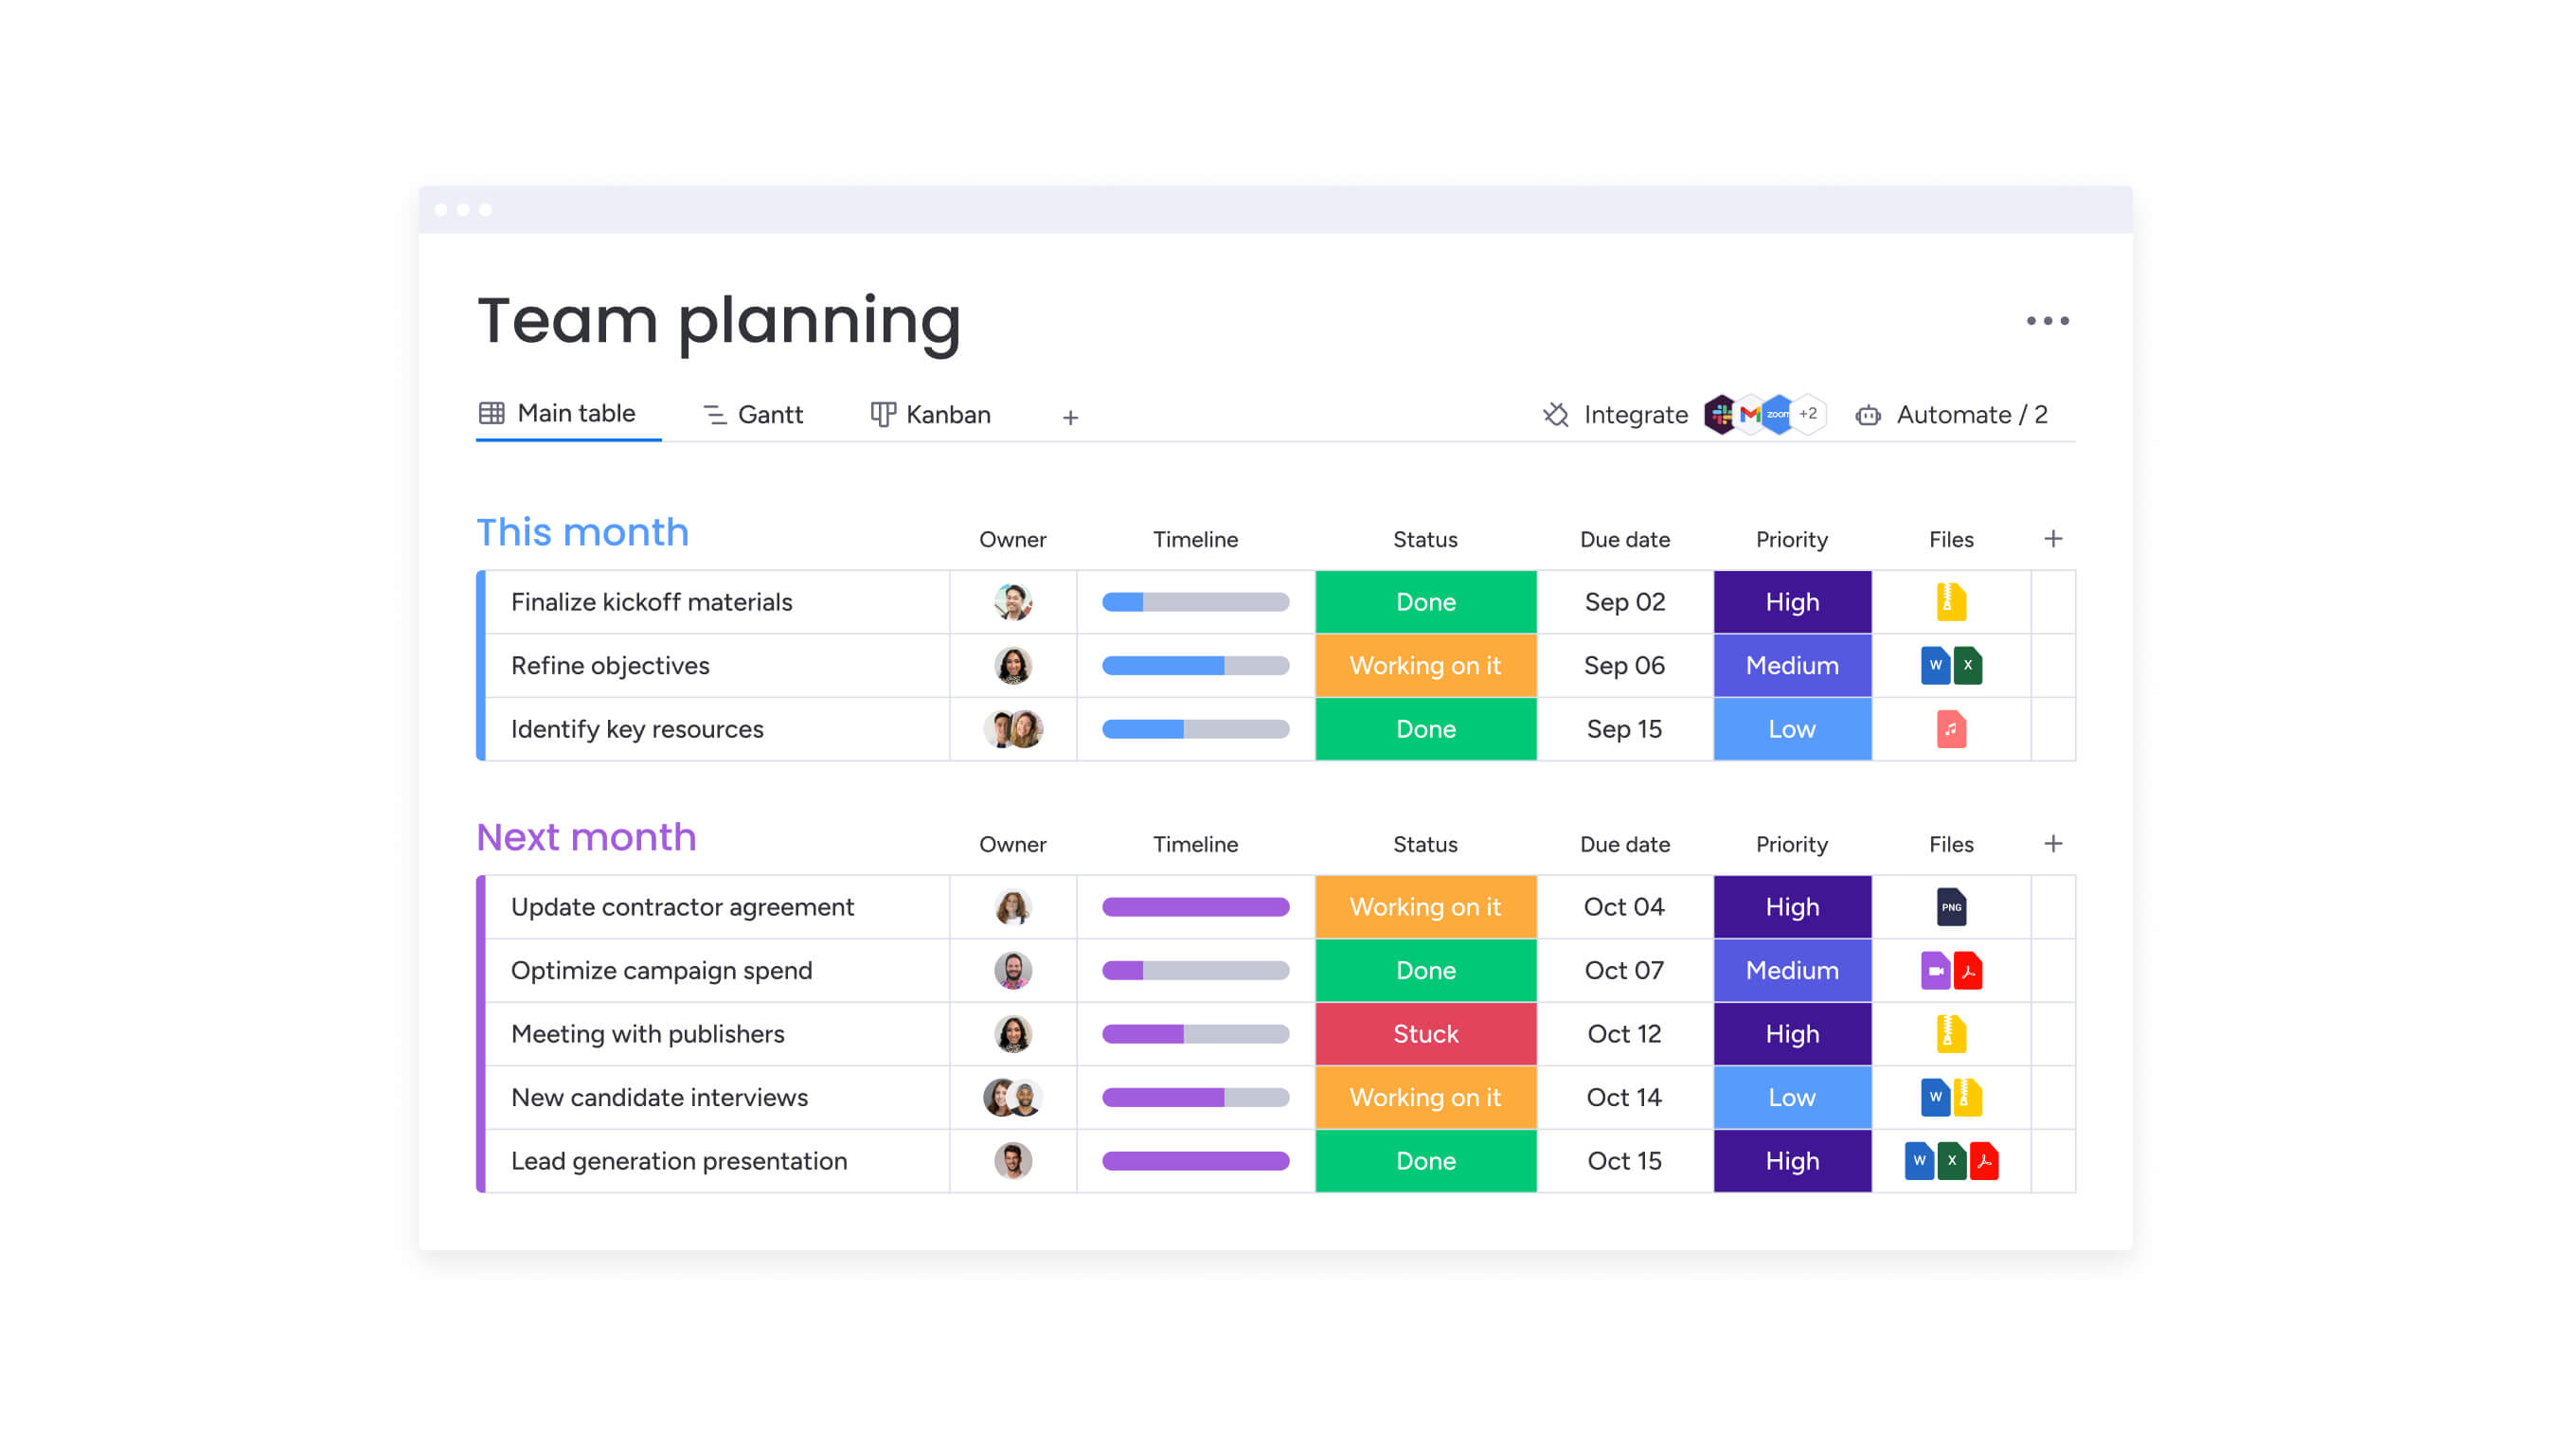
monday work management
monday work management combines dashboard capabilities with complete work execution, making it ideal for marketing teams that want visibility and action in one platform. The platform’s dashboards connect directly to your workflows, so insights immediately drive decisions without switching tools.
Key strengths:
- 200+ native integrations bring all your marketing data together.
- AI-powered risk insights flag campaign issues before they impact results.
- Resource management features show team capacity alongside campaign performance.
- Customizable dashboards scale from team-level to enterprise portfolio views.
Best for: marketing organizations that want to unify planning, execution, and reporting in one platform.
Tableau
Tableau specializes in sophisticated data visualization for organizations with complex analytical needs. Its powerful visualization engine can handle massive datasets and create intricate custom reports.
Key strengths:
- Advanced visualization options for complex data relationships.
- Strong data modeling capabilities.
- Extensive customization through calculated fields.
Best for: organizations with dedicated data teams who need deep analytical capabilities.
Power BI
Microsoft’s Power BI integrates naturally with Office 365 and Azure, making it attractive for organizations already invested in the Microsoft ecosystem. It balances analytical power with user accessibility.
Key strengths:
- Seamless Microsoft integration.
- Competitive pricing for small to mid-size teams.
- Strong self-service analytics features.
Best for: companies using Microsoft tools who want integrated business intelligence.
Looker
Now part of Google Cloud, Looker takes a modeling-first approach to dashboards. It creates a semantic layer that ensures everyone works from consistent data definitions.
Key strengths:
- Powerful data modeling language (LookML).
- Version control for dashboard development.
- Strong governance features.
Best for: technical teams that want programmatic control over their dashboards.
What dashboard features do marketing managers need?
Marketing managers face unique challenges that require specific dashboard capabilities. They must track campaign performance across channels, demonstrate ROI to leadership, and optimize resource allocation, all while managing complex, multi-stakeholder initiatives.
Understanding these specific requirements helps you evaluate which dashboard features will deliver the most value for your marketing operations. The right combination of capabilities transforms scattered data into actionable insights that drive better campaign outcomes.
Critical features for marketing dashboards include:
- Multi-channel campaign tracking: unified views of performance across paid, organic, email, and social channels.
- Attribution modeling: understanding which touchpoints drive conversions and revenue.
- Budget vs. actual tracking: real-time visibility into spend across all campaigns and channels.
- Content performance metrics: tracking engagement, conversion, and ROI by content piece.
- Team workload visibility: understanding who’s working on what to prevent bottlenecks.
Building unified marketing dashboards with monday work management
Creating effective dashboards requires more than just connecting data sources. You need a systematic approach that aligns metrics with strategic goals while keeping the process manageable for your team. This step-by-step framework ensures your dashboards deliver actionable insights from day one.
Step 1: map your data ecosystem
Start by documenting every platform that generates marketing data. Include advertising platforms, social media tools, email systems, analytics platforms, and your CRM.
Identify which metrics matter most from each source and how frequently they need updating. This mapping exercise reveals data gaps and helps prioritize integration efforts.
Step 2: design stakeholder-specific views
Create distinct dashboard views for different audiences. Executive dashboards should focus on ROI, strategic goal progress, and high-level trends.
Operational dashboards for team leads need granular metrics on campaign performance, resource utilization, and upcoming deadlines. This targeted approach ensures each stakeholder gets relevant insights without information overload.
Step 3: establish automated workflows
Configure dashboards to update automatically and trigger actions when thresholds are crossed. Alerts for budget overruns, performance drops, and capacity constraints ensure rapid response. Automated reports deliver insights without manual compilation.
Step 4: implement governance standards
Define who can access, edit, and share different dashboards. Establish naming conventions, update frequencies, and data quality standards.
This governance ensures your dashboards remain reliable and secure as usage scales across the organization. Clear standards prevent confusion and maintain data integrity.
Step 5: connect insights to execution
Link dashboard metrics to actual work items and projects. When a campaign underperforms, your team should be able to drill down from the dashboard directly into the project details.
Understanding what work is happening and what adjustments are needed transforms dashboards from reporting tools into operational command centers.
How AI and automation are changing dashboard software
Dashboard software is getting smarter, and not a moment too soon. The days of manually updating spreadsheets and hunting for insights are ending. Today’s AI-powered tools do the heavy lifting for you, spotting problems and opportunities you might have missed entirely.
Modern AI capabilities in dashboard software include:
- Anomaly detection: automatically identifying unusual patterns that might indicate problems or opportunities.
- Natural language queries: asking questions in plain English and receiving visual answers.
- Automated narrative generation: converting complex data into written summaries and recommendations.
- Predictive analytics: forecasting future performance based on historical patterns and current trends.
For marketing teams, this reduces time spent on reporting and increases time available for optimization. AI can flag spikes in cost per acquisition, suggest reallocations, or predict content resonance for specific audiences.
monday work management integrates AI across workflows, from automatic task assignments to portfolio-level risk identification, allowing teams to stay ahead of challenges instead of reacting to problems.
Choosing the right dashboard software for your organization
Selecting a platform strategically ensures immediate and long-term impact. Consider:
- Integration requirements: ensure connections to all current and planned platforms.
- Team expertise: prioritize intuitive interfaces if analysts are limited.
- Scalability: choose platforms that accommodate growth in users, data sources, and complexity.
- Budget: factor in licensing, implementation, training, and maintenance costs.
- Security and compliance: look for role-based access, audit trails, and encryption.
Platforms like monday work management combine dashboards with workflow execution, bridging the gap between insight and action to accelerate decision-making and performance.
Transform your marketing operations with unified dashboards
The best dashboards go beyond visualization, changing how teams work. Unified data and workflows enable faster decisions, smarter spending, and stronger results.
Marketing leaders benefit from both high-level insights and operational visibility. Modern platforms like monday work management that integrate AI, automation, and predictive analytics provide the speed and agility necessary to stay competitive.
By connecting data, workflows, and decision-making in one environment, teams can focus on driving exceptional marketing results that fuel growth. Try monday work management today.
The content in this article is provided for informational purposes only and, to the best of monday.com‘s knowledge, the information provided in this article is accurate and up-to-date at the time of publication. That said, monday.com encourages readers to verify all information directly.
Frequently asked questions
How long does it take to implement dashboard software for a marketing team?
Implementation time for dashboard software typically ranges from days to weeks, depending on complexity and the platform chosen. Solutions like monday work management can be operational within days thanks to intuitive interfaces and pre-built templates, while more complex BI tools might require weeks or months of setup.
Can dashboard software integrate with financial compliance systems?
Yes, enterprise dashboard software can integrate with financial compliance systems through APIs and secure data connections. Platforms with SOC two certification, GDPR compliance, and role-based access controls provide the security features required for regulated industries.
What's the difference between KPI dashboards and operational dashboards?
KPI dashboards focus on high-level performance indicators and strategic metrics that executives and leaders monitor. Operational dashboards track day-to-day activities, task progress, and team performance, providing the detailed visibility managers need for immediate decisions.
How do I ensure data accuracy in marketing dashboards?
Data accuracy in marketing dashboards depends on consistent data sources, regular validation, and automated updates. Choose platforms that sync in real-time, establish clear data governance rules, and use automated quality checks to flag inconsistencies.
What training is needed for marketing teams to use dashboard software?
Training requirements vary by platform complexity. User-friendly solutions like monday work management require minimal training, often just a few hours of orientation. More technical platforms may need several days of training plus ongoing support for advanced features.
Should I build custom dashboards or use templates?
Start with templates to get quick value, then customize based on your specific needs. Most dashboard software offers industry-specific templates that provide immediate insights while you develop custom views aligned with your unique metrics and goals.