
At the heart of an effective sales report template is data — the lifeblood of any successful sales strategy. By collecting and analyzing metrics such as revenue, win rates, sales cycle length, and customer lifetime value, you can transform raw data into actionable insights.
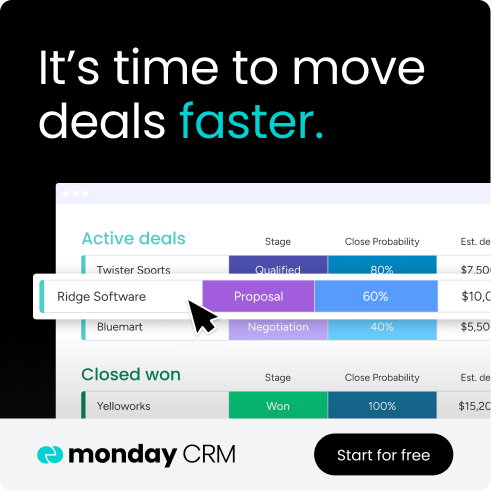
Getting hold of this data and ensuring it’s accurate is another matter altogether. For that, you need a single source of truth, like a reliable sales report. In this guide, we’ll cover the benefits of sales reports, the different kinds that exist, how to create your own, and how using an AI-driven platform like monday CRM can streamline and automate reporting.
Try monday CRMWhat is a sales report template?
A sales report template is a structured framework for capturing, organizing, and analyzing your company’s sales activities and performance over a defined period. These reports can include data such as revenue generated or the percentage of sales achieved compared to targets.
Sales reports help teams evaluate the effectiveness of their sales strategies, forecast future revenue, identify areas for improvement, and make informed decisions to drive business growth. For example, sales teams and business leaders can use sales reports to understand the success of various products and approaches so they can make improvements or duplicate that success in other areas.
Why sales report templates matter
Sales report templates help teams move faster and stay consistent by standardizing how sales data is captured, analyzed, and shared. Instead of rebuilding reports from scratch every time, templates ensure the right metrics appear in the right format, making results easier to compare and act on. This consistency becomes even more important as teams scale and reporting grows more complex.
Here are some of the key benefits of sales report templates:
- Identify top-performing products and services: Determine the most profitable products and services to better allocate resources and focus marketing efforts accordingly.
- Analyze customer profitability: Gain insights into your most profitable customers so that you can implement targeted retention strategies and VIP programs to keep clients engaged.
- Improve sales forecasting and goal-setting: Performance metrics and trends help you set realistic sales goals and improve forecasting to better align resources and strategies.
- Enhance productivity and accountability: Managers and leaders can track individual and team performance, identify areas for improvement, and foster a results-driven sales culture.
That said, as teams grow, static templates often fall short, which is where software-based reporting comes in.
Scaling beyond static sales report templates with smart software
While some downloadable templates can be customized, built-in templates in a platform like monday CRM go further by enabling reports that can be fully tailored to any business. For example, monday CRM’s template center offers 200+ customizable templates, including a sales tracking template, and CRM-based reporting unlocks additional capabilities beyond static files.
Beyond ready-made templates, monday CRM also offers multiple ways to generate and customize sales reports directly from your live data:
- Visual dashboards: Monitor sales activity, performance, and progress by customizing your dashboard view with widgets that pull data from your sales boards to constantly stay aware of critical sales data.
- AI-generated reports: Use built-in AI in monday CRM to generate real-time reports at set frequencies so that you always have fresh data at your fingertips to facilitate decision-making.
- Predictive analytics and sales forecasts: Get a peek into the future with sales forecasts to predict which sales are at risk and which will close based on pipeline data, as well as predictive analytics to make it easier to allocate resources.
- Sales views: Toggle between different sales views in your CRM to get different views into your data, such as a Workload View in monday CRM that shows you your sales team’s current capacity.
Choosing the right frequency: Daily, weekly, and monthly sales report templates
Sales reports can cover different time frames, such as daily, weekly, monthly, quarterly, or annual reports, each focusing on specific metrics according to your business requirements. Some teams may see benefits in using a wide range of time-based sales reports, while others will find it more helpful to focus on reports that demonstrate incremental change.
To make it easier to determine which types of sales reports would most benefit your organization, it’s important to understand the purpose of each report.
| Frequency | Primary use case | Key metrics | Best for |
|---|---|---|---|
| Daily | Track immediate sales activity and pipeline movement to identify urgent issues and quickly course correct | Calls made, meetings booked, deals closed today, pipeline velocity | High-volume sales teams, fast-moving deals, sales managers monitoring daily quotas |
| Weekly | Review short-term trends and individual rep performance to keep deals moving forward | Opportunities created, conversion rates, weekly revenue, individual rep activity | Sales teams with moderate deal cycles, keeping active deals on track |
| Monthly | Evaluate overall team performance against targets and assess strategy effectiveness | Revenue vs. quota, win/loss ratios, average deal size, sales cycle length | Assessing team performance and making tactical adjustments |
| Quarterly | Measure progress toward annual goals and identify seasonal trends to guide strategic planning | Quarterly revenue growth, market share changes, product performance, territory analysis | Executive leadership, evaluating major initiatives, and resource allocation |
| Annual | Provide comprehensive performance review and inform long-term strategic decisions | Year-over-year growth, customer lifetime value, rep retention, total revenue | C-suite and strategic planning, benchmarking, and setting future goals |
What’s important to remember is that short-term reports, like daily and weekly, will help your team stay agile and responsive to immediate challenges and opportunities. On the other hand, long-term reports, like monthly, quarterly, and annual, will give you a window into performance.
These reports help paint a bigger picture of sales progress and sales rep improvements so that you can make meaningful decisions regarding resources, team structures, and manpower.
The 6 key elements of a sales report template
A strong sales report template defines a repeatable structure so teams know exactly what data to include, how to present it, and how to interpret results consistently over time.
The key elements of a sales report will vary depending on the purpose, audience, or type of report. Nevertheless, these are the common core components that help transform raw data into valuable, actionable insights.
- Clear and concise title: The title should provide a clear understanding of the report’s primary focus.
- Introduction: Start with a brief summary that outlines the purpose, goals, and main conclusions of the report.
- Detailed performance metrics and data: The body of the report should include relevant sales KPIs and data, such as:
- Total revenue
- Average revenue per account/product/customer
- Percentage of revenue from new vs. existing customers
- Win rate
- Sales cycle length
- Deal conversion rate
- Quota attainment
- Pipeline coverage
- Sales expense ratio
- Customer lifetime value
- Data visualization: Include graphs, charts, and other visual aids to help illustrate the sales data and trends.
- Interpretation and analysis: Explain what the data shows, including insights, trends, and areas for improvement.
- Conclusion and recommendations: Finish with a summary of the key takeaways and suggested next steps or action plans based on the analysis.
Tracking engagement: Metrics to look for in sales report templates
Although every sales report template looks different, most rely on a shared set of core sales performance metrics, but there are a handful that are likely to show up on almost any sales report. These metrics provide a comprehensive view of sales performance, allowing your business to identify strengths, weaknesses, and opportunities for improvement in your sales strategies and execution.
- Total revenue: Total amount of revenue generated over a set period.
- Average revenue per account/product/customer: The average revenue generated per customer, account, or product provides insights into the productivity and profitability of the sales efforts.
- Percentage of revenue from new vs. existing customers: The breakdown of revenue between new and existing customers indicates the effectiveness of acquisition and retention strategies.
- Win rate: The ratio of deals won and lost reflects the sales team’s proficiency in closing opportunities.
- Sales cycle length: The average time it takes to close a deal, which can identify bottlenecks in the sales process.
- Deal conversion rate: The percentage of leads that convert into closed deals, measuring the efficiency of the sales funnel.
- Quota attainment: The percentage of sales reps meeting or exceeding their sales quotas, indicating overall team performance.
- Pipeline coverage: The ratio of the sales pipeline value to the sales target highlights the health of the sales funnel.
- Sales expense ratio: The ratio of sales expenses to total revenue shows the efficiency of the sales department.
- Customer lifetime value (CLV): The average revenue a customer is expected to generate over their lifetime, which is crucial for understanding customer value.
Aside from these more common metrics, there are others that you might look for to get more details on sales progress. For example, some sales reports might track sales calls and sales rep activity levels to evaluate individual performance and coaching opportunities.
How to build a sales report using a template (7 steps)
Here are the key steps to creating an effective sales report template that’s well-structured, data-driven, and actionable, helping your target audience make informed decisions to improve sales performance and drive business growth.
1. Determine your goals
Start by setting a clear goal and defining the purpose of the report. Understand the target audience and what information would be most relevant to them. For example, are you creating a report for your weekly team meeting or providing a monthly update for C-level executives?
2. Set a timeframe
Determine the appropriate frequency for the report to ensure it’s focused and relevant. For example, a monthly report only needs the latest monthly figures, not the whole year’s data.
3. Collect relevant data
Collect the necessary sales data and metrics, ensuring the information is accurate and up-to-date. Key metrics may include revenue, sales volume, win rate, sales cycle length, and conversion rates. Using CRM software is one of the best ways to maintain accurate sales data in one centralized place.
4. Add visual elements
As a rule, sales reports contain tons of facts and figures. But if you add charts, graphs, and infographics, you can present the information visually so it’s easy to understand and interpret.
5. Discuss your analysis
A key aspect of the report is to provide your analysis and interpretation of the data. No matter your audience, people want to get to the meat of what you’re saying as quickly as possible. So, ensure you explain the trends, identify strengths and weaknesses, and offer insights and recommendations.
6. Summarize the data
Include a summary at the beginning of the report to give readers a high-level overview of the key takeaways. This sets the scene and tells readers what they can expect to know by the end of the report. It’s especially beneficial if you’re writing an in-depth report for time-strapped executives.
7. Recommend next actions
Conclude the report with a clear action plan outlining the next steps and strategies to address any issues or capitalize on opportunities identified in the report. For example, if month-on-month sales are down, explain how you plan to address the decline.
Specialized reporting: From sales pipelines to lead analysis
Specialized metrics can provide deeper insights into specific aspects of your sales operations that may require attention or optimization. Aside from generating reports based on frequency to compare progress, specialized reporting templates can provide deeper insights into what’s going on in your sales team.
Unlike time-based reports that track performance over set periods, specialized reports focus on other aspects of your sales process. These targeted reports help you diagnose issues and identify opportunities that broader reports might miss.
The most valuable specialized reports include:
- Sales pipeline reports: Track deals at each stage of your sales funnel to reveal where prospects get stuck and help forecast future revenue.
- Lead source analysis reports: Understand which marketing channels and campaigns generate the highest-quality leads to inform marketing decisions.
- Sales rep performance reports: Compare individual performance across key metrics to identify top performers and those who need additional coaching.
- Product or service performance reports: Break down sales by offering, which highlights your most profitable products and underperforming inventory.
When used alongside time-based reports, specialized reports complete the bigger picture. For instance, if your monthly report shows declining revenue, a lead source analysis might show that your top-performing channel has dried up, while a pipeline report could show deals stalling at a specific stage.
Integrated sales and marketing report templates
In addition to specialized sales reports, it’s a good idea to integrate marketing reports with sales data to get a holistic view of how marketing campaigns are translating into sales. A platform that combines sales and marketing reports or helps you analyze data for both efforts side-by-side will go a long way in revealing the full customer journey from first touch to closed deal, enabling both teams to make data-driven decisions that improve conversion at every stage.
Integrated sales and marketing report templates show which campaigns actually close deals to enable smarter budget allocation. Teams can better distinguish between marketing activities that drive revenue and those that produce vanity metrics, while creating faster feedback loops between teams.
Key integrated metrics on these kinds of reports include:
- Marketing qualified leads (MQLs) to sales qualified leads (SQLs) conversion rate
- Lead source to closed revenue attribution
- Campaign ROI and customer acquisition cost by channel
- Content engagement to deal velocity correlation
For example, if your integrated sales and marketing report reveals that webinar leads have a 40% higher close rate but take twice as long to convert, marketing can extend nurture sequences for these prospects while sales adjusts their follow-up timing accordingly.
Looking for sales and marketing report templates? Check out customizable templates from monday.com.
Industry-specific sales report solutions
While many sales report templates share common metrics, different industries often require specialized reporting to reflect how revenue is generated and tracked.
| Industry | What the report focuses on | Key metrics to track |
|---|---|---|
| E-commerce | Analyze seasonal performance, promotions, and channel effectiveness to optimize planning and conversion. | Cart abandonment rate, average order value (AOV), product return rate, conversion rate by traffic source, repeat purchase rate |
| Inventory-driven businesses | Identify slow- and fast-moving inventory, optimize reordering, and control carrying costs. | Inventory turnover rate, stock-to-sales ratio, stockout frequency, sell-through rate by product category |
| Hotel & hospitality | Compare direct vs. third-party bookings, understand seasonality, and optimize pricing and staffing. | Occupancy rate, average daily rate (ADR), revenue per available room (RevPAR), booking lead time, channel distribution percentage |
Automate custom sales reporting with monday CRM
Built on the monday.com Work OS, monday CRM helps teams manage the full sales cycle in one centralized platform — from capturing leads and tracking deals to analyzing real-time data in customizable dashboards. Instead of relying on static Word or Excel templates, teams can generate dynamic sales report templates that stay up to date automatically.
Let’s take a closer look at the monday CRM reporting features that support scalable, accurate sales reporting.
Sync data with 200+ app integrations
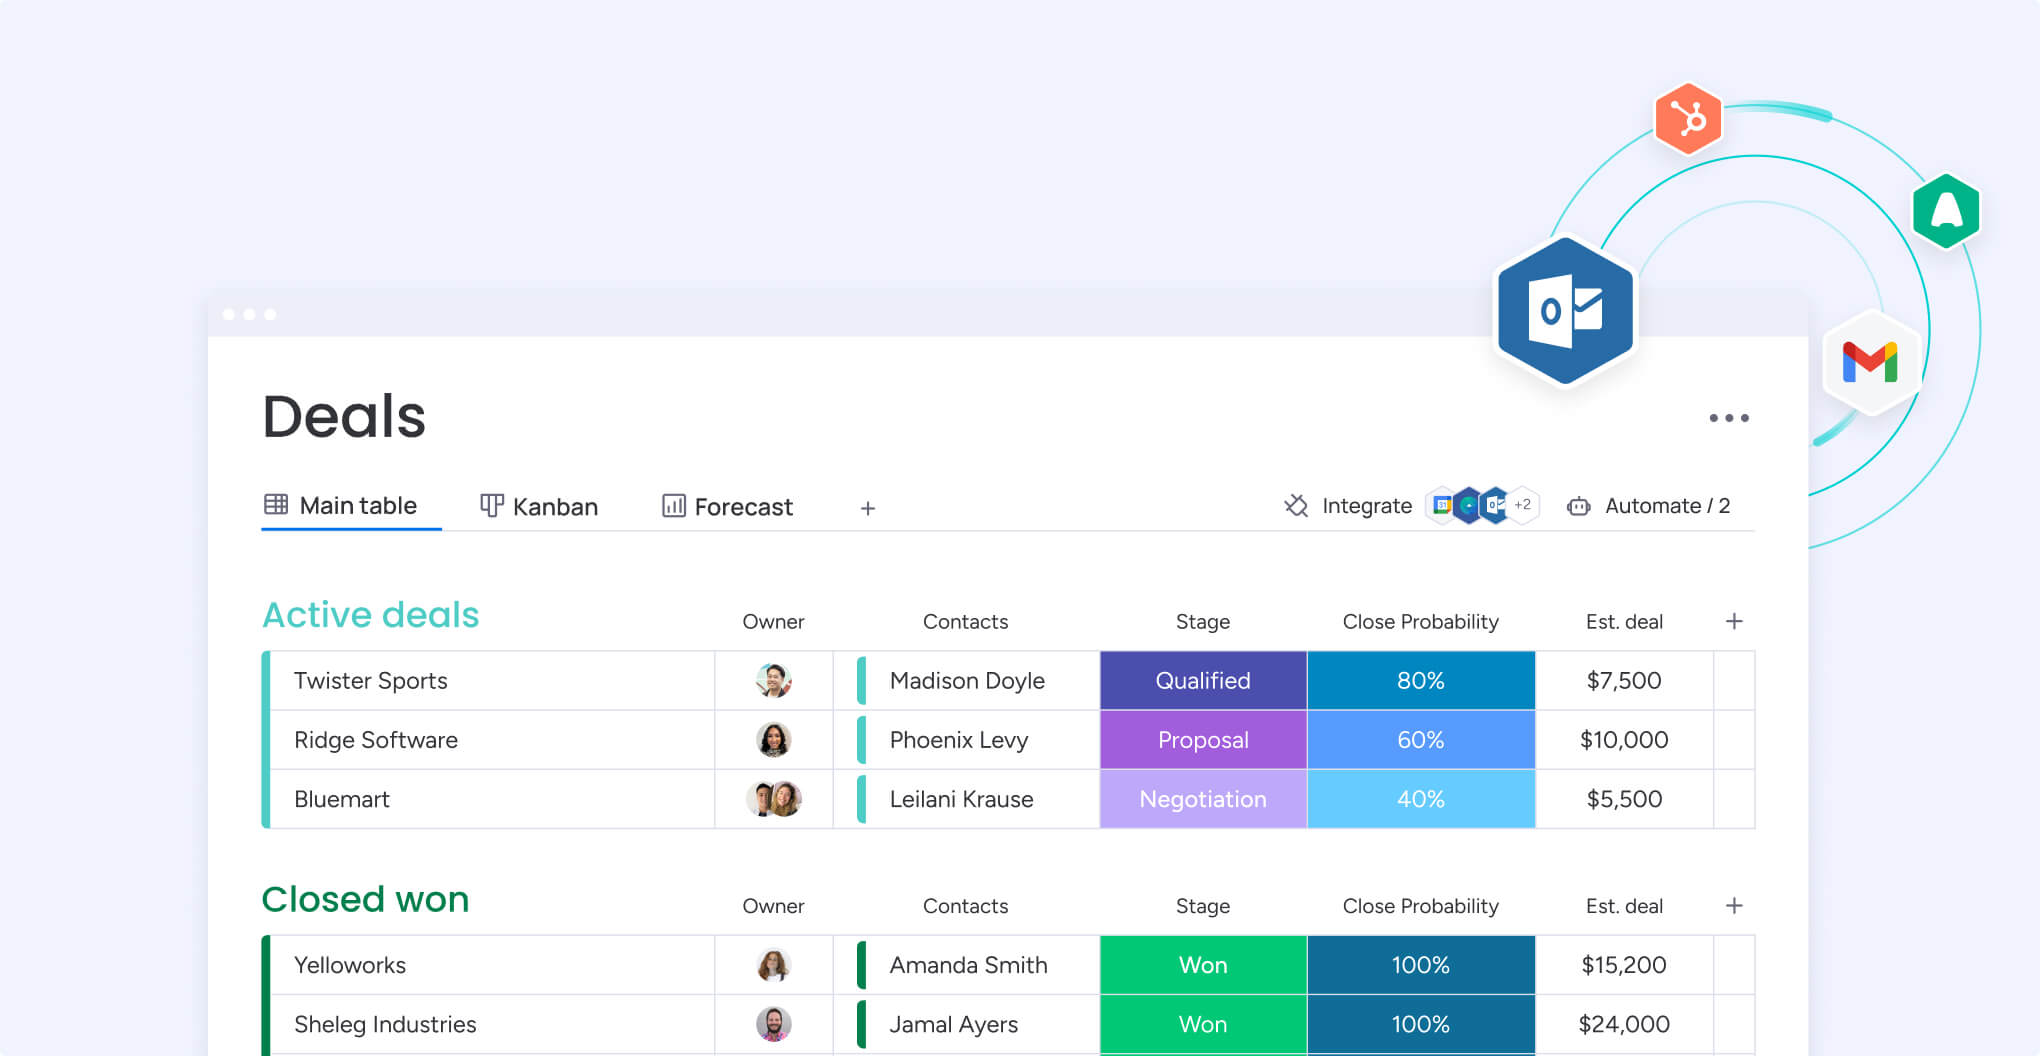
Connect all the apps and external reporting tools you already use, like Salesforce, Gmail, Outlook, or Google Analytics, to focus on the data that matters. No more working with endless screens and fields and risking siloed data between programs. Teams save time by defining, collecting, and organizing the exact sales data they need to build sales reports and sync data to a single source of truth.
Build custom dashboards with AI
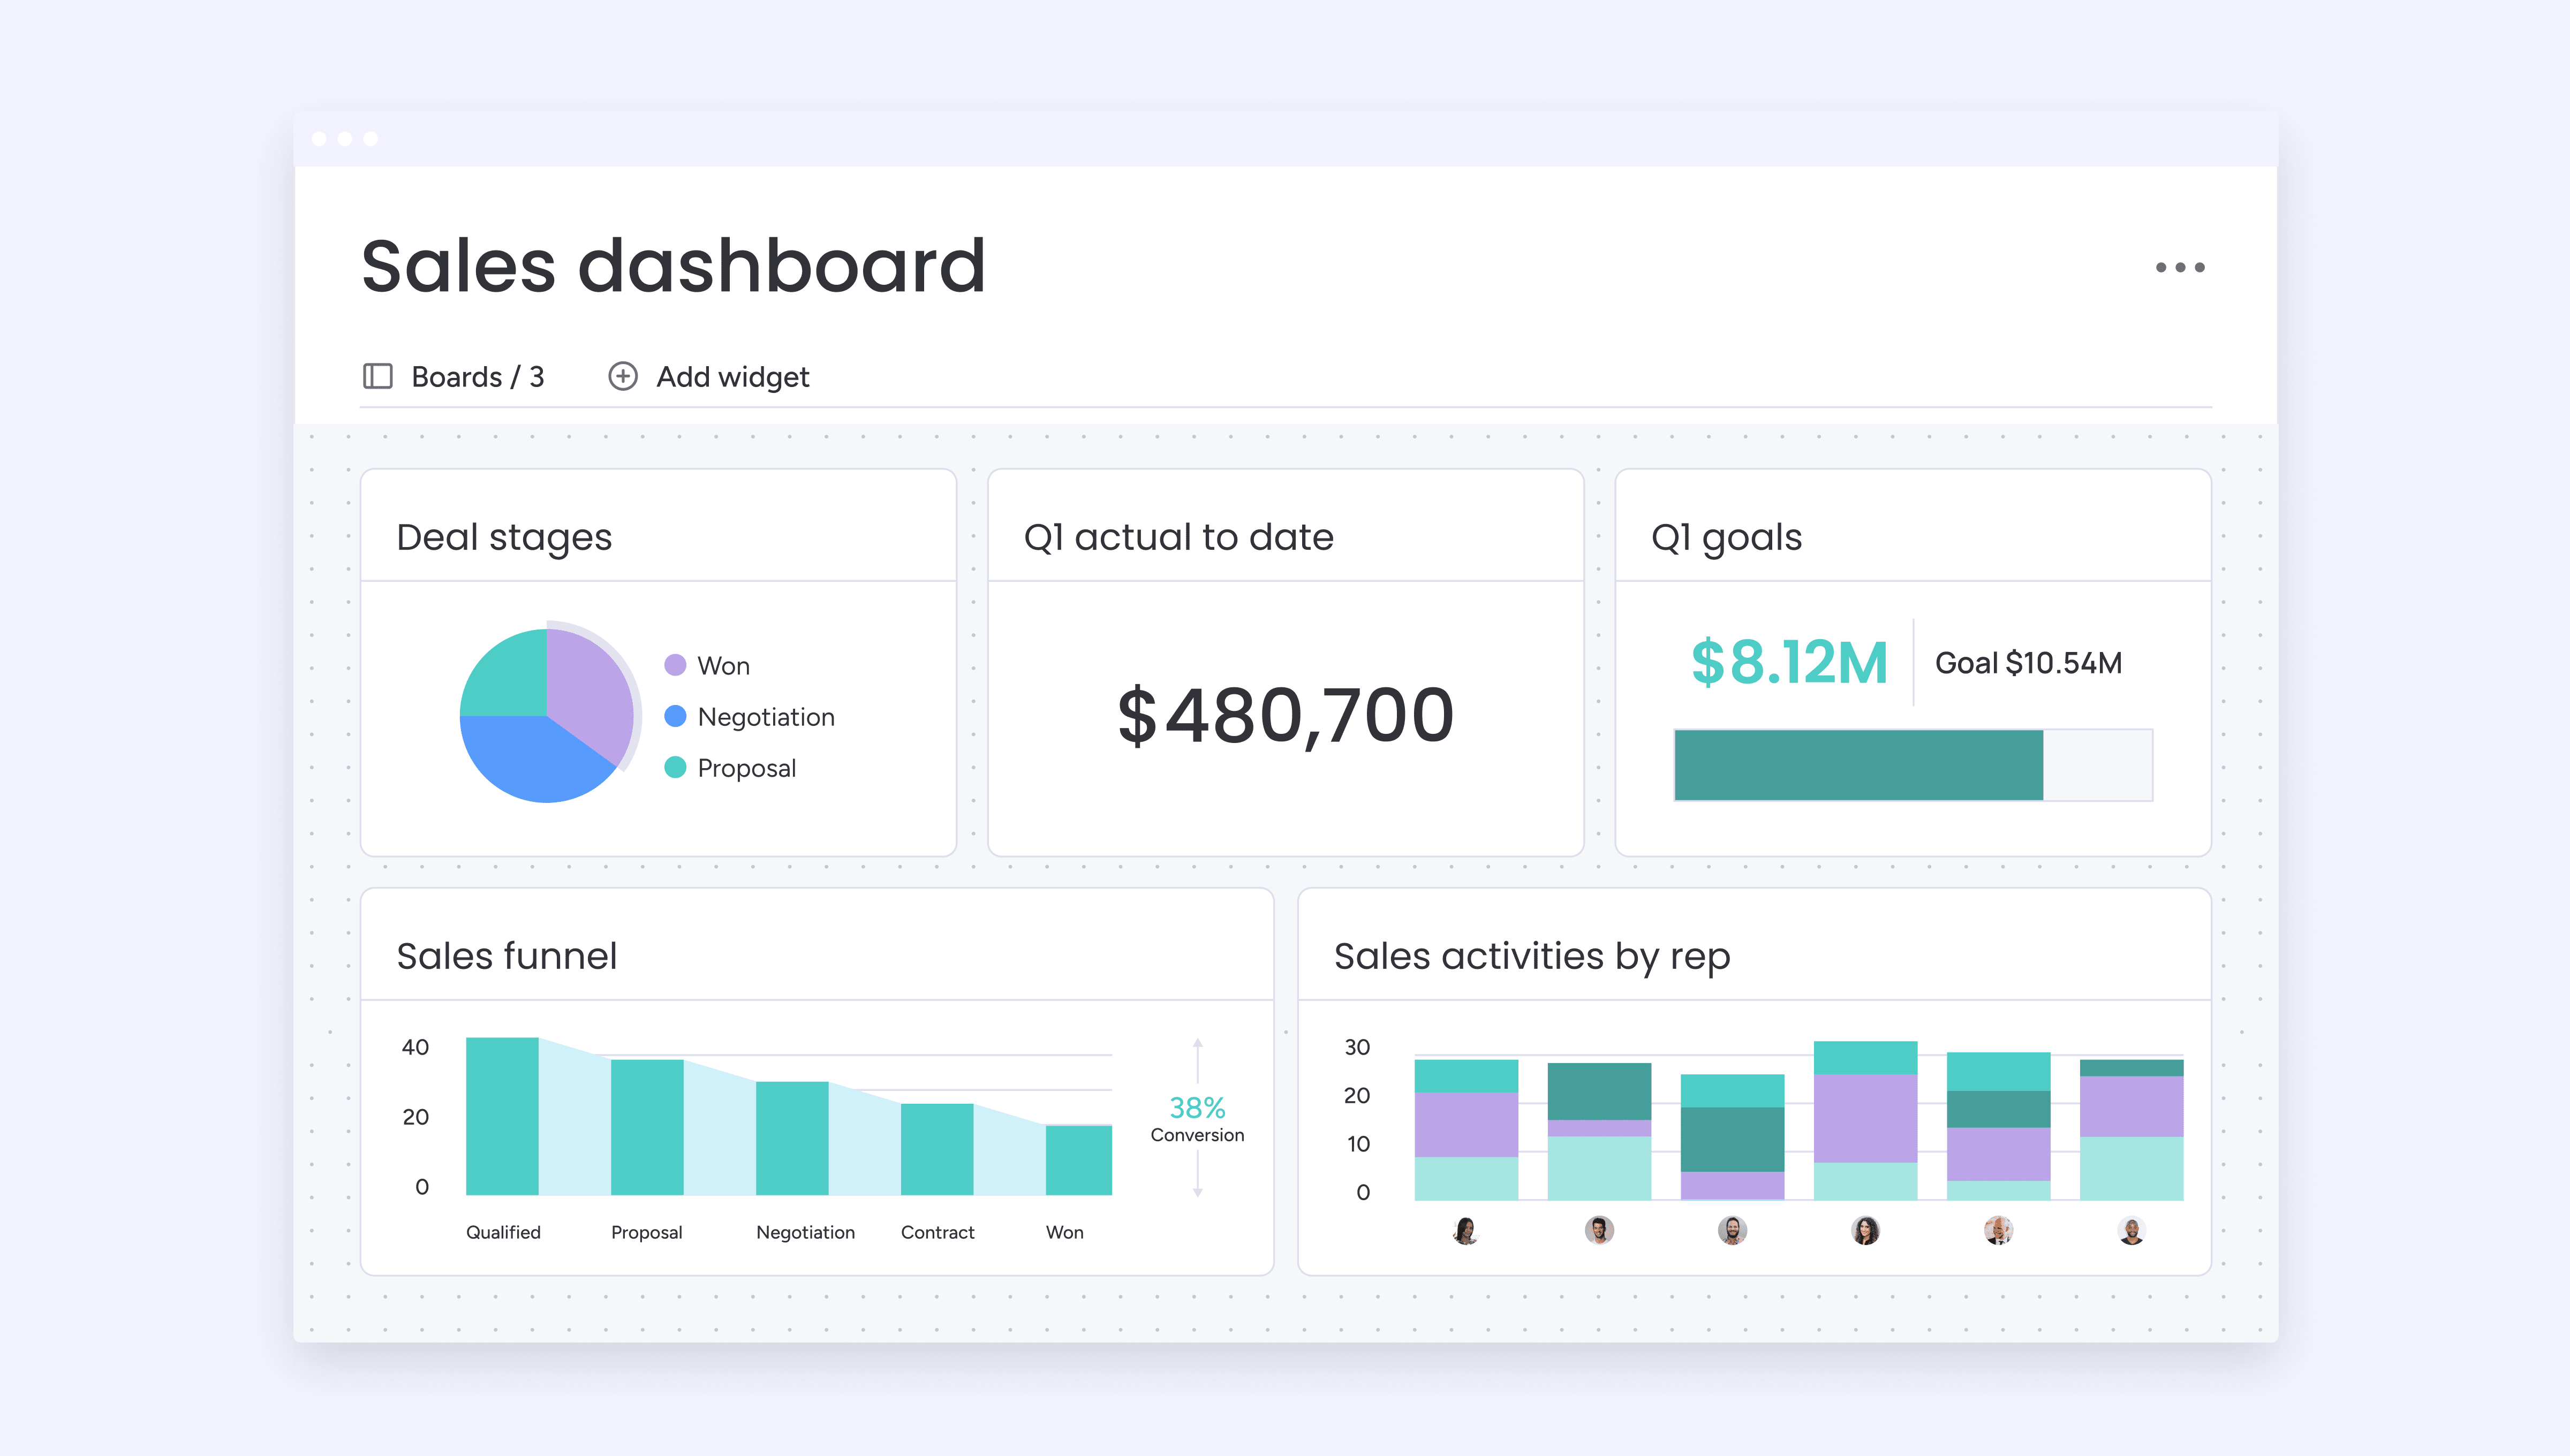
Instantly visualize your deal progress, sales figures, and team performance via the custom sales dashboards in monday CRM. For example, you could ask the built-in AI assistant, monday sidekick, to build you an AI dashboard to better understand your pipeline. Then, you can get a custom dashboard with a Funnel Chart that shows conversion rates between different stages in the funnel, or a Leaderboard to compare sales rep performance within each deal stage.
Access AI reporting and automation

Track data in real time with AI reporting and intelligent automations baked into the monday CRM platform. Managers can use AI to auto-generate daily, weekly, or monthly reports to constantly stay on top of sales performance without manually creating or running the report. Workflow automations allow teams to capture sales data, update records, and generate alerts when metrics fall outside target ranges, reducing manual work while keeping everyone informed.
Stay proactive with forecasting and predictive analytics

Aside from sales reports and dashboards that show progress and live sales data, teams using monday CRM can also proactively influence sales deals with predictive analytics and forecasting. With these features, sales reps can see when a deal is at risk of falling through the cracks so they can intervene early. Sales forecasting can also be helpful to predict future resource needs based on historical data, customer behavior, and sales patterns.
Choosing the right sales report template approach for your team
Creating well-structured, data-driven, and actionable sales reports will help your target audience make informed decisions that lead to improved sales performance and drive business growth.
Start building your sales reports in monday CRM to take advantage of automations, customizations, and AI that can help reveal critical sales patterns and predict future needs. The flexible and intuitive platform makes it simple for teams to collaborate on reports in real-time while also centralizing your data to create a single, reliable source of truth.
Try monday CRMFAQs about sales reports
How do I create an automated sales report to save time on manual entry?
Using an AI-powered platform like monday CRM can help teams automate most, if not all, of their sales reports. It’s simple to use the software to set up workflow automations that capture sales data automatically as deals progress through your pipeline. You can also connect your existing tools through 200+ integrations to sync data automatically, and create custom dashboards that update in real time as your team logs activities.
What are the key differences between a sales activity report and a sales pipeline report?
A sales activity report tracks what your team is doing, whether that’s calls made, emails sent, meetings held, or tasks completed. It measures effort and individual productivity. A sales pipeline report shows where deals are in your sales process, such as your prospects at each stage, deal values, conversion rates, and forecasted revenue. It focuses on outcomes and revenue potential rather than daily actions.
Which metrics should be included in a retail daily sales report template versus an e-commerce report?
While both retail and e-commerce reports should monitor total revenue and compare performance to targets, most of the metrics differ due to the nature of how each interacts with customers. Retail daily reports should track in-store traffic, transactions per hour, average transaction value, inventory sold by category, and sales by location or register. E-commerce reports focus on website traffic, conversion rate by device, cart abandonment rate, average order value, top-selling products online, and sales by traffic source.
Can a sales and marketing report template help in calculating sales commissions?
Yes, integrated sales and marketing reports can inform commission calculations by tracking which leads convert to closed deals and attributing revenue to specific campaigns or sources. However, commission calculation typically requires additional data like individual rep contributions, commission rates by product or tier, and deal close dates. Most organizations use dedicated commission tracking alongside integrated reports for accurate payouts.
What should be included in a comprehensive annual sales report example for stakeholders?
A comprehensive sales report for stakeholders should include metrics like: year-over-year revenue growth, total sales by product line and region, quota attainment rates, customer acquisition and retention metrics, average deal size and sales cycle trends, win/loss analysis, top performing reps and territories, market share changes, and customer lifetime value. Some businesses may also want to add strategic insights about what drove performance and recommendations for the coming year to help stakeholders make informed decisions.