
Sales can look strong on paper and still leave your business tight on cash. The balance sheet shows where that gap builds and what to watch before it becomes a problem.
This article explains where sales activity shows up on the balance sheet, how to estimate credit sales using balance sheet data, and which accounts revenue leaders should monitor as they scale.
It also shows how monday CRM keeps deal data, account activity, and payment tracking connected in one place, so teams can stay on top of receivables and collections without chasing updates.
Try monday CRMKey takeaways
- Track accounts receivable to understand how quickly closed deals turn into cash.
- Treat credit sales as receivables until customers pay the invoice.
- Watch DSO and AR aging to spot collection risk early.
- Align payment terms with cash needs so growth doesn’t outpace collections.
- Use monday CRM dashboards to track pipeline, receivables, and collection status.
What is the difference between sales in the balance sheet vs. the income statement?
Sales revenue appears on the income statement as performance over a period of time. The balance sheet shows your company’s position at a point in time: what you own (assets), what you owe (liabilities), and what remains for shareholders (equity).
You won’t see “sales revenue” as a line item on the balance sheet. Sales still affect it. Each deal changes accounts like accounts receivable, inventory, and cash depending on how and when customers pay.
Why sales revenue lives on the income statement
Sales revenue tracks what your company earned during a specific timeframe (monthly, quarterly, yearly). Accounting rules record revenue when you deliver a product or perform a service, even if the customer pays later.
Example: If you deliver $10,000 in software licenses in January, revenue hits January’s income statement. Cash timing depends on payment terms and collection speed, which shows up through balance sheet accounts.
This difference matters because it separates operational performance from cash reality. Revenue teams influence both, and the balance sheet makes the timing visible.
How sales transactions flow into balance sheet accounts
A single sale can change multiple balance sheet accounts, depending on sale type and payment timing. Close a $5,000 credit deal and you typically see:
- Accounts receivable increases by $5,000: the customer owes you payment
- Inventory decreases by the cost of goods sold: goods leave stock (for product-based businesses)
- Cash increases when the customer pays: cash moves only after collection
Accounts receivable reflects completed sales that still need collection. For revenue leaders, that means deal volume alone doesn’t tell the full story. Collection timing determines when sales support payroll, inventory replenishment, and investment.
How sales activity changes assets on the balance sheet
Sales activity changes what your business holds in cash, receivables, and inventory. Payment terms and collection speed determine how quickly revenue turns into usable cash. Track these shifts to guide deal structure and follow-up priorities.
Where to find sales impact on your balance sheet
Sales activity shows up across the balance sheet, even though “sales” never appears as a line item. Focus on 3 areas: accounts receivable (what customers still owe), inventory (what’s available to sell), and cash (what’s already been collected).
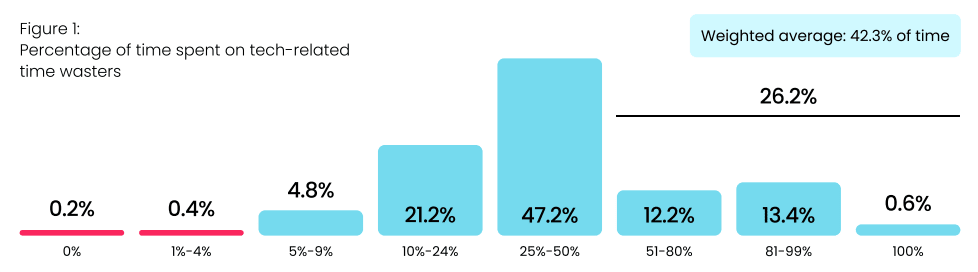
This visibility matters because follow-up work often competes with tool friction. In monday.com’s state of sales technology 2025 survey, 73.4% of sales leaders said tech time-wasters take more than 25% of their team’s time, and nearly half estimate that 25–50% of the day is lost to fighting sales tools. When updates, handoffs, and payment status live in different systems, receivables age quietly, and collection risk builds.
Tracking receivables, inventory, and cash together gives revenue leaders early signals — even when the day-to-day gets busy.
Step 1: Track accounts receivable as a sales health signal
Accounts receivable represents completed credit sales that have not yet turned into cash. This balance reflects deal volume and how consistently teams follow through after the close.
Follow-through is where many teams feel the squeeze. In the same monday.com survey, 26.2% of leaders said tech wastes more than half their team’s time. When reps juggle disconnected tools, collections work becomes reactive. Invoices age, follow-ups slip, and cash timing becomes harder to predict.
The relationship stays simple:
Beginning AR + Credit sales − Cash collected = Ending AR
If your team closes $100,000 in credit deals in a month, receivables increase by that amount. If customers pay $80,000 during the same period, AR drops accordingly.
Receivables trends reveal what’s really happening:
-
Rising AR balances signal strong sales, slower collections, or extended terms
-
Declining AR points to faster payment cycles or fewer new credit deals
-
AR aging highlights where follow-up needs attention before risk grows
Days sales outstanding (DSO) adds context by showing how long invoices take to convert into cash on average. Lower DSO means faster cash availability. Higher DSO signals capital tied up longer than planned.
Step 2: Monitor inventory changes tied to sales activity
For product-based businesses, sales directly affect inventory. When goods ship to customers, inventory drops by the cost of those items, not the sale price.
Example: If inventory starts at $50,000 and you sell products that cost $15,000 to produce, inventory falls to $35,000 even if the sale price was higher.
Sales teams influence inventory outcomes through deal timing and product mix:
- Fast-moving products: Clear inventory quickly and free up capital
- Slow-moving products: Sit longer in stock and tie up cash
Inventory turnover measures how efficiently inventory converts into sales. Calculate it as: Cost of goods sold ÷ Average inventory
Higher turnover signals strong alignment between sales demand and inventory levels. Service-based businesses see limited inventory impact since they sell time or expertise rather than physical goods.
Step 3: Analyze cash changes from customer payments
Cash reflects when sales activity actually funds the business. Cash sales increase balances right away. Credit sales increase cash only after customers pay.
This delay creates the cash conversion cycle, the time between closing a deal and receiving spendable funds.
Example timeline for a credit sale with net-60 terms:
- January 15: Deal closes and creates $10,000 in accounts receivable
- January 15: Inventory drops by $6,000 (cost of goods sold)
- March 15: Customer pays, receivable clears, and cash increases by $10,000
During that gap, the sale counts as revenue but does not support expenses or growth. Shorter payment terms and clear follow-up help revenue teams speed up collection and improve cash availability without changing deal volume
How credit sales affect your financial position
Credit sales record revenue before cash arrives. That timing gap affects liquidity, planning, and day-to-day operations, with cash tied up in receivables until customers pay.
Teams rely on credit terms to close deals, but delayed collection can strain working capital. Clear visibility into receivables, payment timing, and follow-up keeps growth aligned with cash availability.
What qualifies as a credit sale?
A credit sale happens when a customer receives goods or services before payment. Your business extends payment terms and records the amount owed as accounts receivable.
Common credit sale scenarios include:
- Invoice-based sales: B2B transactions with net payment terms such as net-30 or net-60
- Subscription billing: Services delivered during a billing period and paid at the end of that period
- Installment payments: Larger purchases paid across multiple scheduled payments
Cash sales require payment at the point of delivery. Card payments count as cash sales from the seller’s perspective because the business receives funds quickly, even if the customer pays their card balance later.
From invoice to balance sheet asset
A credit sale moves through predictable balance sheet stages. Take an $8,000 consulting project with net-30 terms:
Accounts receivable represents a legal claim to payment. Cash enters the picture only after the invoice is paid. Closed deals improve cash position after collection, not at contract signature.
Set payment terms with cash flow in mind
Payment terms shape when sales support operations. Shorter terms improve cash timing. Longer terms increase flexibility for customers but delay liquidity.
Common approaches include:
- Net-15 or net-20: Faster collection and lower receivables exposure
- Net-45 or net-60: Longer collection cycles that require stronger cash planning
- Early payment discounts (2/10 net 30): Faster payment in exchange for a small discount
Track payment behavior by customer segment to refine terms over time. Reliable payers often accept shorter cycles. Higher-risk accounts benefit from tighter follow-up and clearer expectations.
5 balance sheet accounts every sales leader should monitor
Balance sheet accounts show how sales activity affects cash, inventory, and future obligations. These five accounts give revenue leaders a clear view of financial health beyond pipeline totals.
1. Accounts receivable
Track total receivables, AR aging, and DSO to understand how quickly closed deals convert to cash and where follow-up is needed.
2. Inventory levels
Monitor inventory turnover, slow-moving items, and stock availability to see where cash is tied up and where demand is shifting.
3. Cash and equivalents
Watch operating cash flow and cash reserves to understand how quickly sales activity is funding the business.
4. Deferred revenue
Deferred revenue reflects customer payments received before services are delivered. These balances represent future obligations rather than earned revenue.
Key considerations:
- Upfront payments: Improve near-term cash
- Revenue recognition timing: Revenue moves from deferred to earned as delivery occurs
- Delivery tracking: Progress against prepaid commitments
Subscription and retainer models often carry higher deferred revenue balances tied to longer service periods.
5. Contract assets
Contract assets capture work completed but not yet invoiced under milestone-based agreements.
Example: A project reaches 60% completion, while billing milestones trigger invoices at 50% and 100%. Work completed after the 50% invoice creates a contract asset until the next billing event.
Track contract assets to understand revenue in progress that will convert to receivables and cash once billing milestones are met.
How to calculate credit sales using balance sheet data
Balance sheet data can help revenue teams estimate credit sales when income statement detail is limited or when validating reported numbers. Changes in accounts receivable, paired with cash collected, show how much selling activity occurred during a given period.
This approach gives sales and RevOps leaders a clearer view of deal flow, collection timing, and forecasting accuracy.
Step 1: Use the credit sales formula
Calculate credit sales with this formula: Credit sales = Ending accounts receivable − Beginning accounts receivable + Cash collected
Example for a quarter:
- Beginning accounts receivable (January 1): $45,000
- Ending accounts receivable (March 31): $52,000
- Cash collected during the quarter: $38,000
Credit sales = $52,000 − $45,000 + $38,000 = $45,000
New credit sales increase accounts receivable. Customer payments reduce it. The net change in receivables plus collected cash reflects total credit sales for the period.
Step 2: Read receivables changes in context
Movement in accounts receivable shows the relationship between selling and collecting.
Common patterns include:
- Receivables increase: Credit sales exceed collections
- Receivables decrease: Collections exceed new credit sales
- Receivables stay flat: Sales and collections offset each other
Example: Beginning accounts receivable equals $30,000. Ending accounts receivable equals $35,000. Cash collected equals $25,000.
Credit sales = $35,000 − $30,000 + $25,000 = $30,000
Sales totaled $30,000, collections totaled $25,000, and receivables increased by $5,000.
Step 3: Track collection efficiency
Collection efficiency shows how much of your credit sales turned into cash during the same period.
Calculate it as: Collection efficiency = (Cash collected ÷ Credit sales) × 100
Example: Credit sales equal $50,000. Cash collected equals $55,000.
Efficiency equals 110%, which reflects collections from both current and prior periods.
Use this metric to spot trends:
- Above 100%: Teams collected past-due invoices
- Around 100%: Sales and collections stayed aligned
- Below 100%: Receivables grew faster than collections
Sustained declines point to follow-up gaps or terms that no longer fit customer behavior.
Strengthen working capital through sales decisions
Working capital reflects the cash available to run the business in the near term. Sales activity affects it through receivables, inventory, and collection timing.
Step 1: Measure the cash conversion cycle
The cash conversion cycle shows how long it takes for sales activity to turn into usable cash.
Calculate it as:
Days inventory outstanding + Days sales outstanding − Days payable outstanding
Example:
- Days inventory outstanding: 45.6
- Days sales outstanding: 27.4
- Days payable outstanding: 27.4
Cash conversion cycle = 45.6 days
This number represents the time between investing in inventory and collecting payment from customers. Shorter cycles reduce cash pressure and improve planning flexibility.
Step 2: Align growth with cash capacity
Rapid sales growth can strain working capital when collections lag or inventory builds faster than demand.
Common pressure points include:
- Extended payment terms that delay cash
- Inventory purchased ahead of confirmed demand
- Credit granted without clear payment history
Sales teams protect cash flow when they review terms, flag high-risk accounts early, and coordinate with finance on exposure limits.
Step 3: Adjust payment terms intentionally
Payment terms set expectations for cash timing. Clear standards help teams scale without introducing friction.
Typical approaches include:
- Net-15 or net-20: Faster collection and lower receivables exposure
- Net-30: Standard timing for many B2B transactions
- Net-45 or net-60: Longer cycles that require stronger cash forecasting
- Early payment discounts: Faster payment in exchange for a small reduction in invoice value
Track payment behavior over time to refine terms. Customers with consistent payment history often support shorter cycles, while newer or higher-risk accounts benefit from tighter controls.
How monday CRM connects sales activity with financial visibility
Sales teams live in pipeline views. Finance teams live in invoices, aging reports, and spreadsheets. When those systems don’t connect, revenue leaders lose visibility into what actually happens after a deal closes.
That disconnect shows up clearly in how sales leaders feel about their tools. In monday.com’s state of sales technology 2025 survey, 61% say they’re at least somewhat satisfied with their CRM, yet only 21% believe it delivers enough value for the cost, and 81% are actively considering a replacement. The frustration isn’t about features. It’s about fundamentals: ineffective reporting, poor integration, and lack of real-time updates — the exact gaps that make it hard to track receivables, payment status, and cash timing.
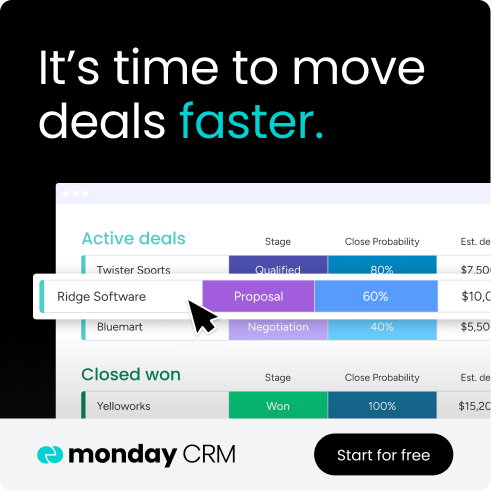
monday CRM closes that gap. It connects deals, accounts, and payment status in one shared workflow, so revenue teams see how pipeline turns into cash and finance teams get the context they need without chasing updates. Follow-up becomes visible, risk surfaces earlier, and balance sheet signals stay tied to day-to-day sales activity.
Track deal progress alongside payment status
monday CRM captures deal details at every stage of the customer journey and keeps that information connected as accounts move forward.
When a deal closes, the platform records:
- Deal value and payment terms
- Account and contact details
- Expected payment timing
- Collection status over time
As payments come in, teams update account records and track partial payments, overdue invoices, and follow-up activity. This gives revenue leaders a clear view of which deals still represent open exposure and which ones have converted to cash.
Classify revenue activity with automation
Automation rules and monday AI help teams categorize deals based on payment terms, billing cadence, and delivery timelines.
Teams can organize deals as:
- Cash transactions: Payment recorded immediately
- Credit transactions: Amount tracked until payment clears
- Recurring or milestone-based deals: Revenue tracked across delivery stages
Sales teams close deals with consistent fields and workflows. Finance teams review structured data without chasing missing details.
Coordinate sales and finance workflows
When sales and finance work in different systems, gaps form quickly. Follow-up slips. Payment status gets buried. Forecasts drift away from reality.
The state of sales technology 2025 survey shows how common this problem is. 44% of sales leaders point to disjointed communication tools as a driver of silos, while 43% cite limited visibility into shared customer data. Another 39% call out poor CRM integration, and the same percentage flag inadequate reporting and analytics. These issues all lead to the same outcome: teams can’t see the full path from deal to cash.
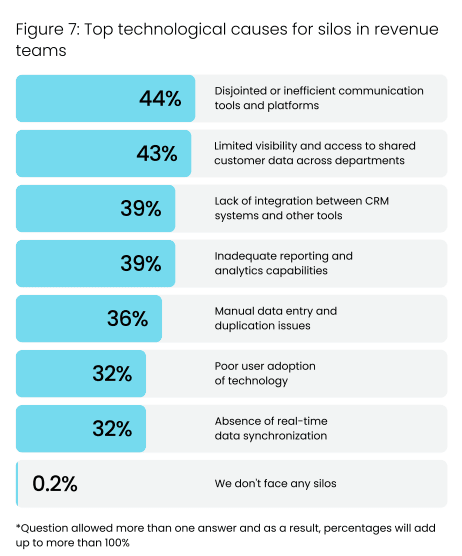
Those silos come at a cost. 35% of leaders report weaker data-driven decision-making, 34% say inconsistent processes slow scaling, and 32% tie silos directly to higher operational costs. When finance lacks deal context and sales lacks payment visibility, both teams react later than they should.
monday CRM removes that friction. Built-in workflows connect sales and finance around the same deal data, payment status, and account history. When deals close, finance teams get what they need to invoice and follow up, while sales teams stay aware of account risk and outstanding receivables. Visibility stays shared, and handoffs stay clean.
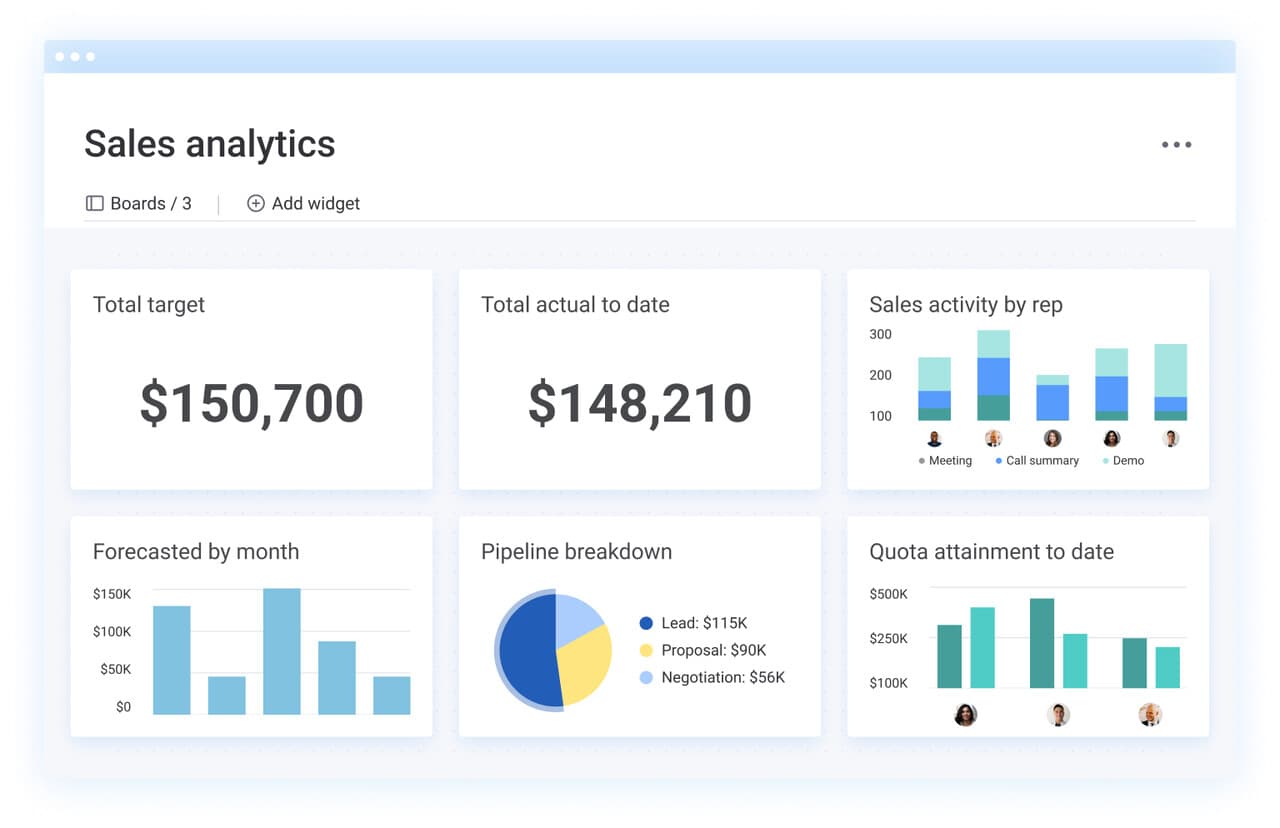
Use dashboards to monitor revenue and cash signals
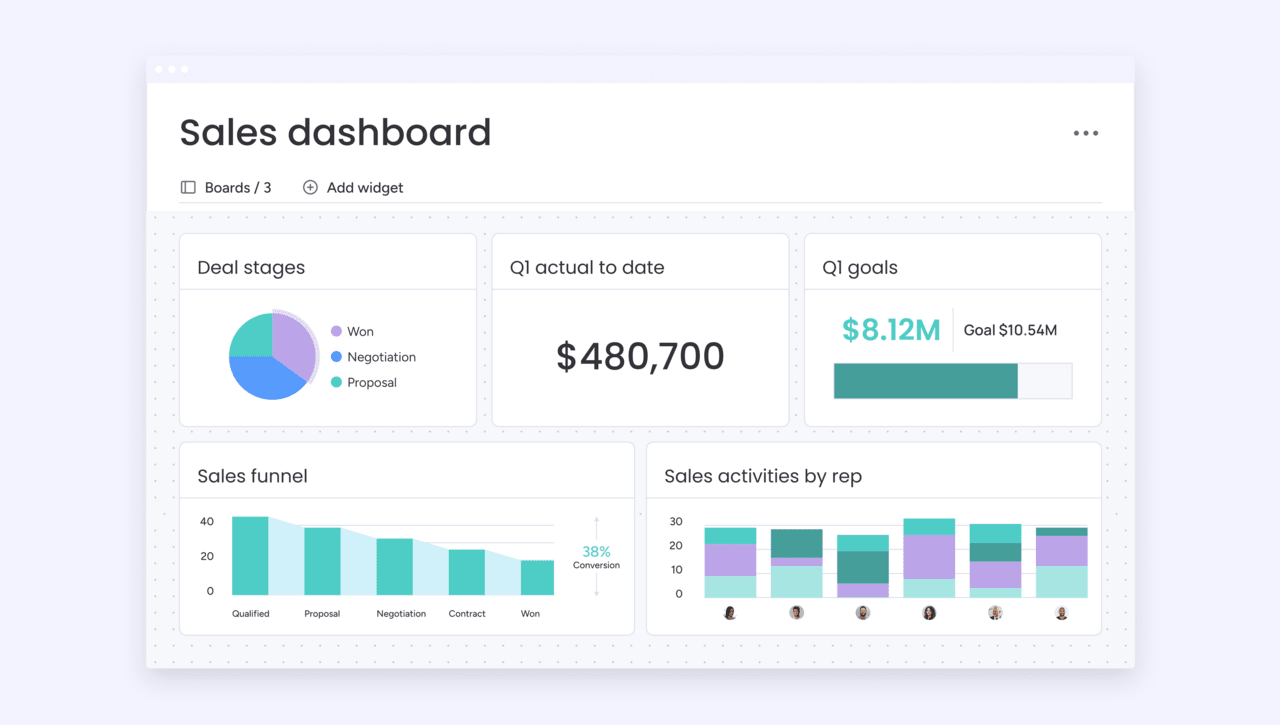
Custom dashboards give revenue leaders and RevOps teams visibility into pipeline performance and payment status in one view.
Dashboards can show:
- Open receivables by account or owner
- Days sales outstanding and aging trends
- Expected collections based on pipeline and terms
- Sales targets alongside collection progress
This visibility helps teams spot risk early, prioritize follow-up, and plan growth with clearer cash expectations.
Make financial impact visible to the whole revenue team
When sales activity and payment tracking live in the same platform, teams spend less time reconciling data and more time acting on it.
Sales reps understand how payment timing affects their accounts. Managers track performance alongside exposure. Revenue leaders make decisions with current data instead of waiting for end-of-month reports.
Try monday CRMConnecting sales performance to financial health
Tie sales activity to financial outcomes to plan growth with fewer surprises. Track receivables, payment timing, and account status alongside pipeline data to protect cash flow as you scale.
monday CRM gives revenue teams a clear view of what happens after deals close, with deals, accounts, and payment tracking in one workflow.
Get started with monday CRM trialFAQs
How do milestone-based projects affect balance sheet tracking?
Milestone-based projects often create contract assets when work is completed before invoicing. These balances represent earned value that converts to accounts receivable once the next billing milestone triggers an invoice.
What happens to receivables when a customer disputes an invoice?
Disputed invoices typically remain in accounts receivable until resolved. Many teams flag disputed balances separately to avoid overstating collectible cash and to prioritize resolution.
How do write-offs affect sales reporting?
When a receivable is written off as uncollectible, it reduces accounts receivable and records a bad debt expense. Revenue remains reported from the original sale, while cash expectations adjust.
How often should revenue teams review receivables data?
Weekly reviews help spot risk early. Monthly reviews support forecasting and planning. High-growth teams often monitor aging and DSO continuously through dashboards.
Can CRM data support finance reviews without replacing accounting systems?
Yes. CRM data gives finance teams context around deal status, payment terms, and customer history. Accounting systems remain the source of record, while CRM data supports faster reviews and better coordination.
How can RevOps teams use balance sheet signals to improve forecasting?
RevOps teams combine pipeline data with receivables trends and payment timing to refine forecasts. This helps align expected revenue with realistic cash inflows and reduces variance between projected and actual results.