
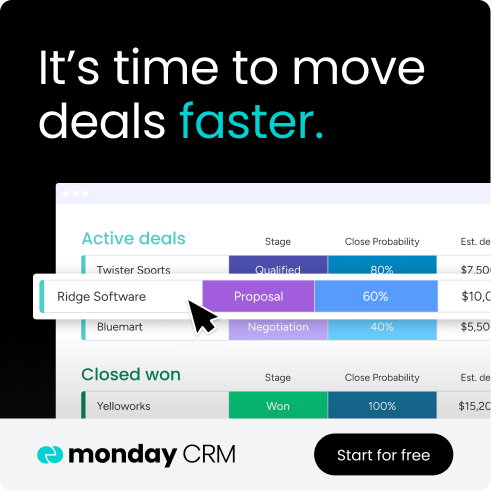
Tracking sales metrics is like using a fitness tracker. You don’t just want to know how many steps you took yesterday; you want a full ptoicture of your health, including heart rate, sleep quality, and performance trends that predict tomorrow’s results.
Sales metrics work the same way. They give you real-time insights into your pipeline, show you where deals are slowing down, and even forecast what’s ahead. With the right data in hand, you can spot problems early, double down on what’s working, and guide your team toward sustainable growth.
In this article, we’ll break down 26 essential sales metrics, explore how AI and monday CRM transform numbers into action, and show you how to build reporting systems that actually drive performance.
Try monday CRMWhat are sales metrics and why do they matter?
Sales metrics are sets of data that organizations use to track performance, both for teams and individuals. Sales metrics help team leaders track progress against set goals and identify strategies that either need improvement or that have proven to be successful.
Tracking sales productivity metrics is important to understand what’s working in your sales funnel. Additionally, sales managers can use data gathered from sales metrics to set compensation or incentives that help boost revenue growth.
Sales metrics vs. KPIs: What’s the difference?
Sales metrics and KPIs (Key Performance Indicators) are often used interchangeably, but they serve distinct purposes. Sales metrics are raw data points that measure specific activities, like the number of calls made, emails sent, or deals closed. KPIs, however, are strategic measurements that are directly tied to your specific business goals, such as revenue growth rate, customer acquisition cost, or sales conversion rates.
Although all KPIs are metrics, not all metrics qualify as KPIs. The key difference is that KPIs align with broader business outcomes, and sales metrics don’t necessarily need to align with broader company goals.
Sales funnel metrics: Tracking every stage
Sales metrics aren’t just something you glance at after a deal wraps up. To really reap the benefits of monitoring sales metrics, it needs to be done at every stage of your sales funnel. Without keeping tabs on everything from your initial leads all the way through to closed revenue, you’re operating in the dark and likely missing out on opportunities to make improvements to your pipeline and double down on what’s crushing it.
Let’s say a SaaS company brings in 1,000 leads in a month. Of those, 200 become qualified prospects, 100 book demos, and the company closes 25 deals. Suddenly, the demo-to-close rate tanks, and the company needs to understand why. Maybe it’s the pricing, or your sales reps aren’t following up in time.
Whatever the reason, without tracking metrics in each step of the sales funnel, it would be much harder to nail down why revenue dropped, and the team would spend a lot more time and resources figuring out where to start fixing things.
26 essential sales metrics to track
When it comes to tracking sales metrics, there are 3 main categories that give you the full picture and help sales teams understand not just whether they’re hitting numbers, but what they can do to keep improving. They are:
- Sales activity metrics, which track what your team is actually doing day-to-day
- Sales performance metrics, which look at how well those activities are converting
- Customer satisfaction metrics, which track whether you’re keeping customers happy
But it’s also important for sales leaders to track sales employee metrics to understand factors that can impact performance, onboarding, or goal attainment. Below, we’ll look at 26 different sales metrics spanning each category that are important to track to build and maintain a successful sales strategy.
Sales activity metrics
These metrics track the day-to-day actions your sales reps take — calls, emails, follow-ups, and social touches. They show whether your team is putting in the activity needed to create opportunities.
1. Number of calls made
What it measures: The total number of outbound calls made by sales reps in a given period
Why it’s important: Helps managers identify reps who might need coaching on activity levels or time management, since higher call volumes typically lead to better results
Formula: Total outbound calls ÷ time period
2. Email open rates
What it measures: Measures the percentage of sent emails that are opened by prospects
Why it’s important: Shows how well your subject lines and sender reputation are performing, helping teams optimize outreach effectiveness before prospects even read your message
Formula: (Number of emails opened ÷ number of emails sent) × 100
3. Email response rate
What it measures: The percentage of sent emails that receive a response from prospects
Why it’s important: Indicates the quality and relevance of your email content, helping you refine messaging to generate more engagement and conversations
Formula: (Number of email responses ÷ number of emails sent) × 100
4. Meetings booked
What it measures: The number of qualified meetings or demos booked with prospects
Why it’s important: Bridges the gap between initial outreach and serious sales conversations, showing how well prospecting efforts convert to real opportunities
Formula: Total meetings scheduled ÷ time period
5. Follow-ups sent
What it measures: The number of follow-up touch points completed after initial contact
Why it’s important: Ensures prospects don’t fall through the cracks and measures rep consistency, since most deals require multiple interactions to close
Formula: Total follow-up activities ÷ time period
6. Social media interactions
What it measures: The number of meaningful interactions with prospects on social platforms
Why it’s important: Builds relationships and credibility before formal sales conversations, since modern buyers research vendors online
Formula: Total social interactions ÷ time period
Sales performance metrics
Performance metrics reveal how effective those activities are at moving deals forward. They highlight conversion rates, deal size, and pipeline health — the indicators most closely tied to revenue.
7. Lead conversion rate
What it measures: The percentage of leads that convert to qualified opportunities
Why it’s important: Shows how effectively your team qualifies prospects and identifies which lead sources produce the highest-quality opportunities for better resource allocation
Formula: (Number of qualified opportunities ÷ total leads) × 100
8. Win rate
What it measures: The percentage of qualified opportunities that result in closed deals
Why it’s important: Indicates overall sales effectiveness and helps identify coaching opportunities, while also informing more accurate revenue forecasting
Formula: (Number of deals won ÷ total opportunities) × 100
9. Average deal size
What it measures: The average dollar value of closed deals over a specific period.
Why it’s important: Helps with revenue forecasting and identifies opportunities to increase deal values through upselling, cross-selling, or better positioning.
Formula: Total revenue ÷ number of deals closed
10. Sales cycle length
What it measures: The average time it takes to move from initial contact to closed deal
Why it’s important: Helps create systems to optimize processes and set realistic expectations, since longer cycles can tie up resources and impact cash flow
Formula: Total days from first contact to close ÷ number of deals
11. Pipeline velocity
What it measures: How quickly revenue flows through your sales pipeline
Why it’s important: Combines deal size, win rate, and cycle length to show the overall health and efficiency of your sales process
Formula: (Number of opportunities × average deal size × win rate) ÷ sales cycle length
12. Monthly recurring revenue (MRR)
What it measures: The predictable revenue generated each month from subscriptions or recurring contracts
Why it’s important: Provides a stable baseline for forecasting and helps track business growth trends, especially crucial for SaaS and subscription businesses
Formula: Total monthly subscription revenue
13. Customer acquisition cost (CAC)
What it measures: The total cost to acquire one new customer
Why it’s important: Shows whether what you’re spending on sales and marketing is sustainable and helps determine pricing strategies and budget allocation
Formula: (Total sales and marketing costs) ÷ number of new customers acquired
14. Year-over-year growth
What it measures: The percentage increase in revenue compared to the same period in the previous year
Why it’s important: Shows long-term business trajectory and helps identify seasonal trends while providing context for performance beyond short-term fluctuations
Formula: ((Current year revenue – previous year revenue) ÷ previous year revenue) × 100
15. Weighted value of pipeline
What it measures: The total potential revenue in your pipeline adjusted by the probability of each deal closing
Why it’s important: Provides a more realistic forecast than raw pipeline value by accounting for deal likelihood, helping with resource planning and revenue predictions
Formula: Sum of (deal value × probability of closing for each opportunity)
16. Average profit margin
What it measures: The percentage of revenue that remains as profit after subtracting all costs associated with generating that revenue
Why it’s important: Shows the actual profitability of your sales efforts and helps identify which deals, products, or customer segments are most valuable to the business
Formula: ((Revenue – total costs) ÷ revenue) × 100
Customer satisfaction metrics
Customer-focused metrics measure loyalty and long-term value. They help you understand retention, satisfaction, and whether customers are likely to renew, churn, or expand.
17. Net promoter score (NPS)
What it measures: Customer loyalty and likelihood to recommend your product to others
Why it’s important: Predicts customer retention and organic growth potential, while identifying customers who might churn (0-6 rating) or become advocates (9-10 rating)
Formula: % of promoters – % of detractors
18. Customer satisfaction score (CSAT)
What it measures: How satisfied customers are with your product or service experience
Why it’s important: Helps identify improvement areas and correlates strongly with retention rates
Formula: (Number of satisfied customers ÷ total survey responses) × 100
19. Customer retention rate
What it measures: The percentage of customers who continue using your product over a specific time period
Why it’s important: Indicates product/market fit and helps predict long-term revenue stability, since retention is cheaper than acquisition
Formula: ((Customers at end of period – new customers) ÷ customers at start of period) × 100
20. Customer lifetime value (CLV)
What it measures: Measures the total revenue expected from a customer throughout their entire relationship with your company
Why it’s important: Helps determine how much you can spend on acquisition while informing customer success investment decisions
Formula: Average order value × purchase frequency × average customer lifespan
21. Churn rate
What it measures: The percentage of customers who stop using your product or unsubscribe from your services in a given time period
Why it’s important: Signals product or service issues and directly impacts revenue growth, making it essential to identify at-risk areas
Formula: (Number of customers lost ÷ total customers at start of period) × 100
22. Renewal rate
What it measures: The percentage of customers who renew their contracts or subscriptions when they expire
Why it’s important: Directly impacts recurring revenue and shows customer satisfaction and product value, making it critical for subscription businesses such as SaaS companies
Formula: (Number of customers who renewed ÷ total customers up for renewal) × 100
Sales employee metrics
These metrics look inward at the health of your sales team — turnover, engagement, coaching impact, and hiring. Strong people metrics ensure long-term consistency in hitting revenue goals.
23. Employee turnover rate
What it measures: The percentage of sales team members who leave the company within a given time period
Why it’s important: Tracks team stability and employee satisfaction, since high turnover disrupts revenue flow and increases hiring and training costs
Formula: (Number of sales reps who left ÷ Average number of sales reps during the period) × 100
24. Coaching impact score
What it measures: The improvement in performance after targeted coaching sessions
Why it’s important: Provides proof of coaching effectiveness and helps managers refine training strategies for maximum impact
Formula: ((Post-coaching performance – pre-coaching performance) ÷ pre-coaching performance) × 100
25. Rep engagement score
What it measures: Overall engagement and morale of the sales team, typically gathered through surveys or performance tracking tools
Why it’s important: Provides insight into team health and burnout risks because high engagement usually leads to lower turnover and better performance
Formula: (Total engagement points ÷ total possible points) × 100
26. Average time-to-hire
What it measures: The average number of days it takes to fill a sales position, from job posting to offer acceptance
Why it’s important: Identifies bottlenecks in the recruiting process and improves hiring efficiency to avoid lost revenue opportunities and strain on existing team members
Formula: Total days to fill all open sales positions ÷ number of positions filled
Sales metrics and AI: Predictive insights & automationd
While any of the sales metrics mentioned above can give you important insights into past performance, artificial intelligence takes your reporting a step further by also giving you predictions on how certain metrics can be expected to perform.
For example, an AI-powered platform teams use to track metrics, like monday CRM, can offer predictions on customer churn. By analyzing things like historical patterns of customer churn rates along with current data like customer engagement rates and sentiment analysis of recent interactions, your CRM can forecast future churn rates. This way, teams can intervene early to counteract behavior that often precedes customers leaving, and essentially improve the customer churn rate in the long run.
Aside from predicting specific metrics, AI also goes a long way in helping teams automate critical insights. Instead of manually sifting through mountains of data to spot trends, AI can instantly flag when performance deviates from expected patterns or highlight opportunities for improvement. This gives sales teams more time to spend on selling and building relationships instead of analyzing data.
Try monday CRMLeading indicators vs lagging indicators in sales
When tracking sales metrics, it’s important to understand the difference between leading and lagging indicators. Both tell completely different stories about your sales performance and require different approaches.
- Leading indicators predict the future so that teams can adjust in real time. These include activities like the number of calls made, emails sent, meetings booked, and follow-up activities. If you see your leading indicators dropping, you can immediately adjust activities to get back on track.
- Lagging indicators show the results of past actions and can’t be changed once they’ve occurred. These include things like sales cycle length, win rates, and customer churn. While you can’t control these metrics, they still help teams understand whether their strategies are working and provide historical data to inform future decisions.
The magic happens when you track both together. Leading indicators help you make meaningful changes in real time, while lagging indicators validate whether your efforts are paying off.
How to measure sales metrics in 7 steps
Now that you have a full picture of all the different types of sales metrics, you may be wondering how to actually put them into practice. Sales metrics require ongoing monitoring, which means you need a specific process in place to first establish the metrics you want to follow and then see them through to the result.
Here are some quick steps you can take to start measuring sales metrics:
Step 1: Define your sales goals and objectives
Before diving into metrics, get crystal clear on what you’re trying to achieve. Are you focused on increasing revenue, improving conversion rates, or reducing customer acquisition costs? Your goals will determine which metrics matter most.
Step 2: Start with a few key metrics
Pick a mix of leading and lagging indicators that directly tie to your goals. Consider starting with the basics like win rate, sales cycle length, and lead conversion rate, then expand as you get comfortable.
Step 3: Choose the right tracking tools
Look for an analytics tool, like CRM software, that can capture, store, and analyze your data. Prioritize solutions that integrate with your existing tech stack and that can automate data collection to cut down on manual work for your team.
Step 4: Establish baseline measurements
Gather at least 3-6 months of historical data to understand current performance levels. This gives you a realistic starting point and helps you set achievable targets.
Step 5: Set up regular reporting cadences
Create daily, weekly, and monthly reporting schedules. Daily reports should focus on activity metrics, weekly on sales pipeline metrics and movement, and monthly on broader performance trends and goal achievement.
Step 6: Train your team
Ensure everyone understands not only how to correctly input data, but also why each metric matters and how they connect to individual and team success.
Step 7: Review and optimize regularly
Schedule quarterly reviews to assess which metrics are driving action and which aren’t adding value. Swap out metrics that aren’t helping you reach your goals or adjust targets based on what you’ve learned.
Top sales metrics for managers to track
Sales managers don’t need to track every single metric daily. Instead, a few numbers give the clearest view of team health and revenue growth:
- Win rate reveals how effective your team is at turning opportunities into closed deals — and where coaching may be needed.
- Lead conversion rate shows whether reps are focusing on the right prospects or wasting time on poor-fit leads.
- Sales cycle length highlights bottlenecks in your process and whether deals are moving at a healthy pace.
- Pipeline velocity combines speed, deal size, and win rate into one powerful indicator of how fast revenue is moving through your funnel.
- Customer churn rate reveals how many customers leave in a given period, undoing new sales progress and draining growth.
For managers, these 5 metrics act like a dashboard light system, signaling when to celebrate, when to intervene, and where to allocate coaching or resources.
Sales metrics dashboard: How to build reports that tell a story
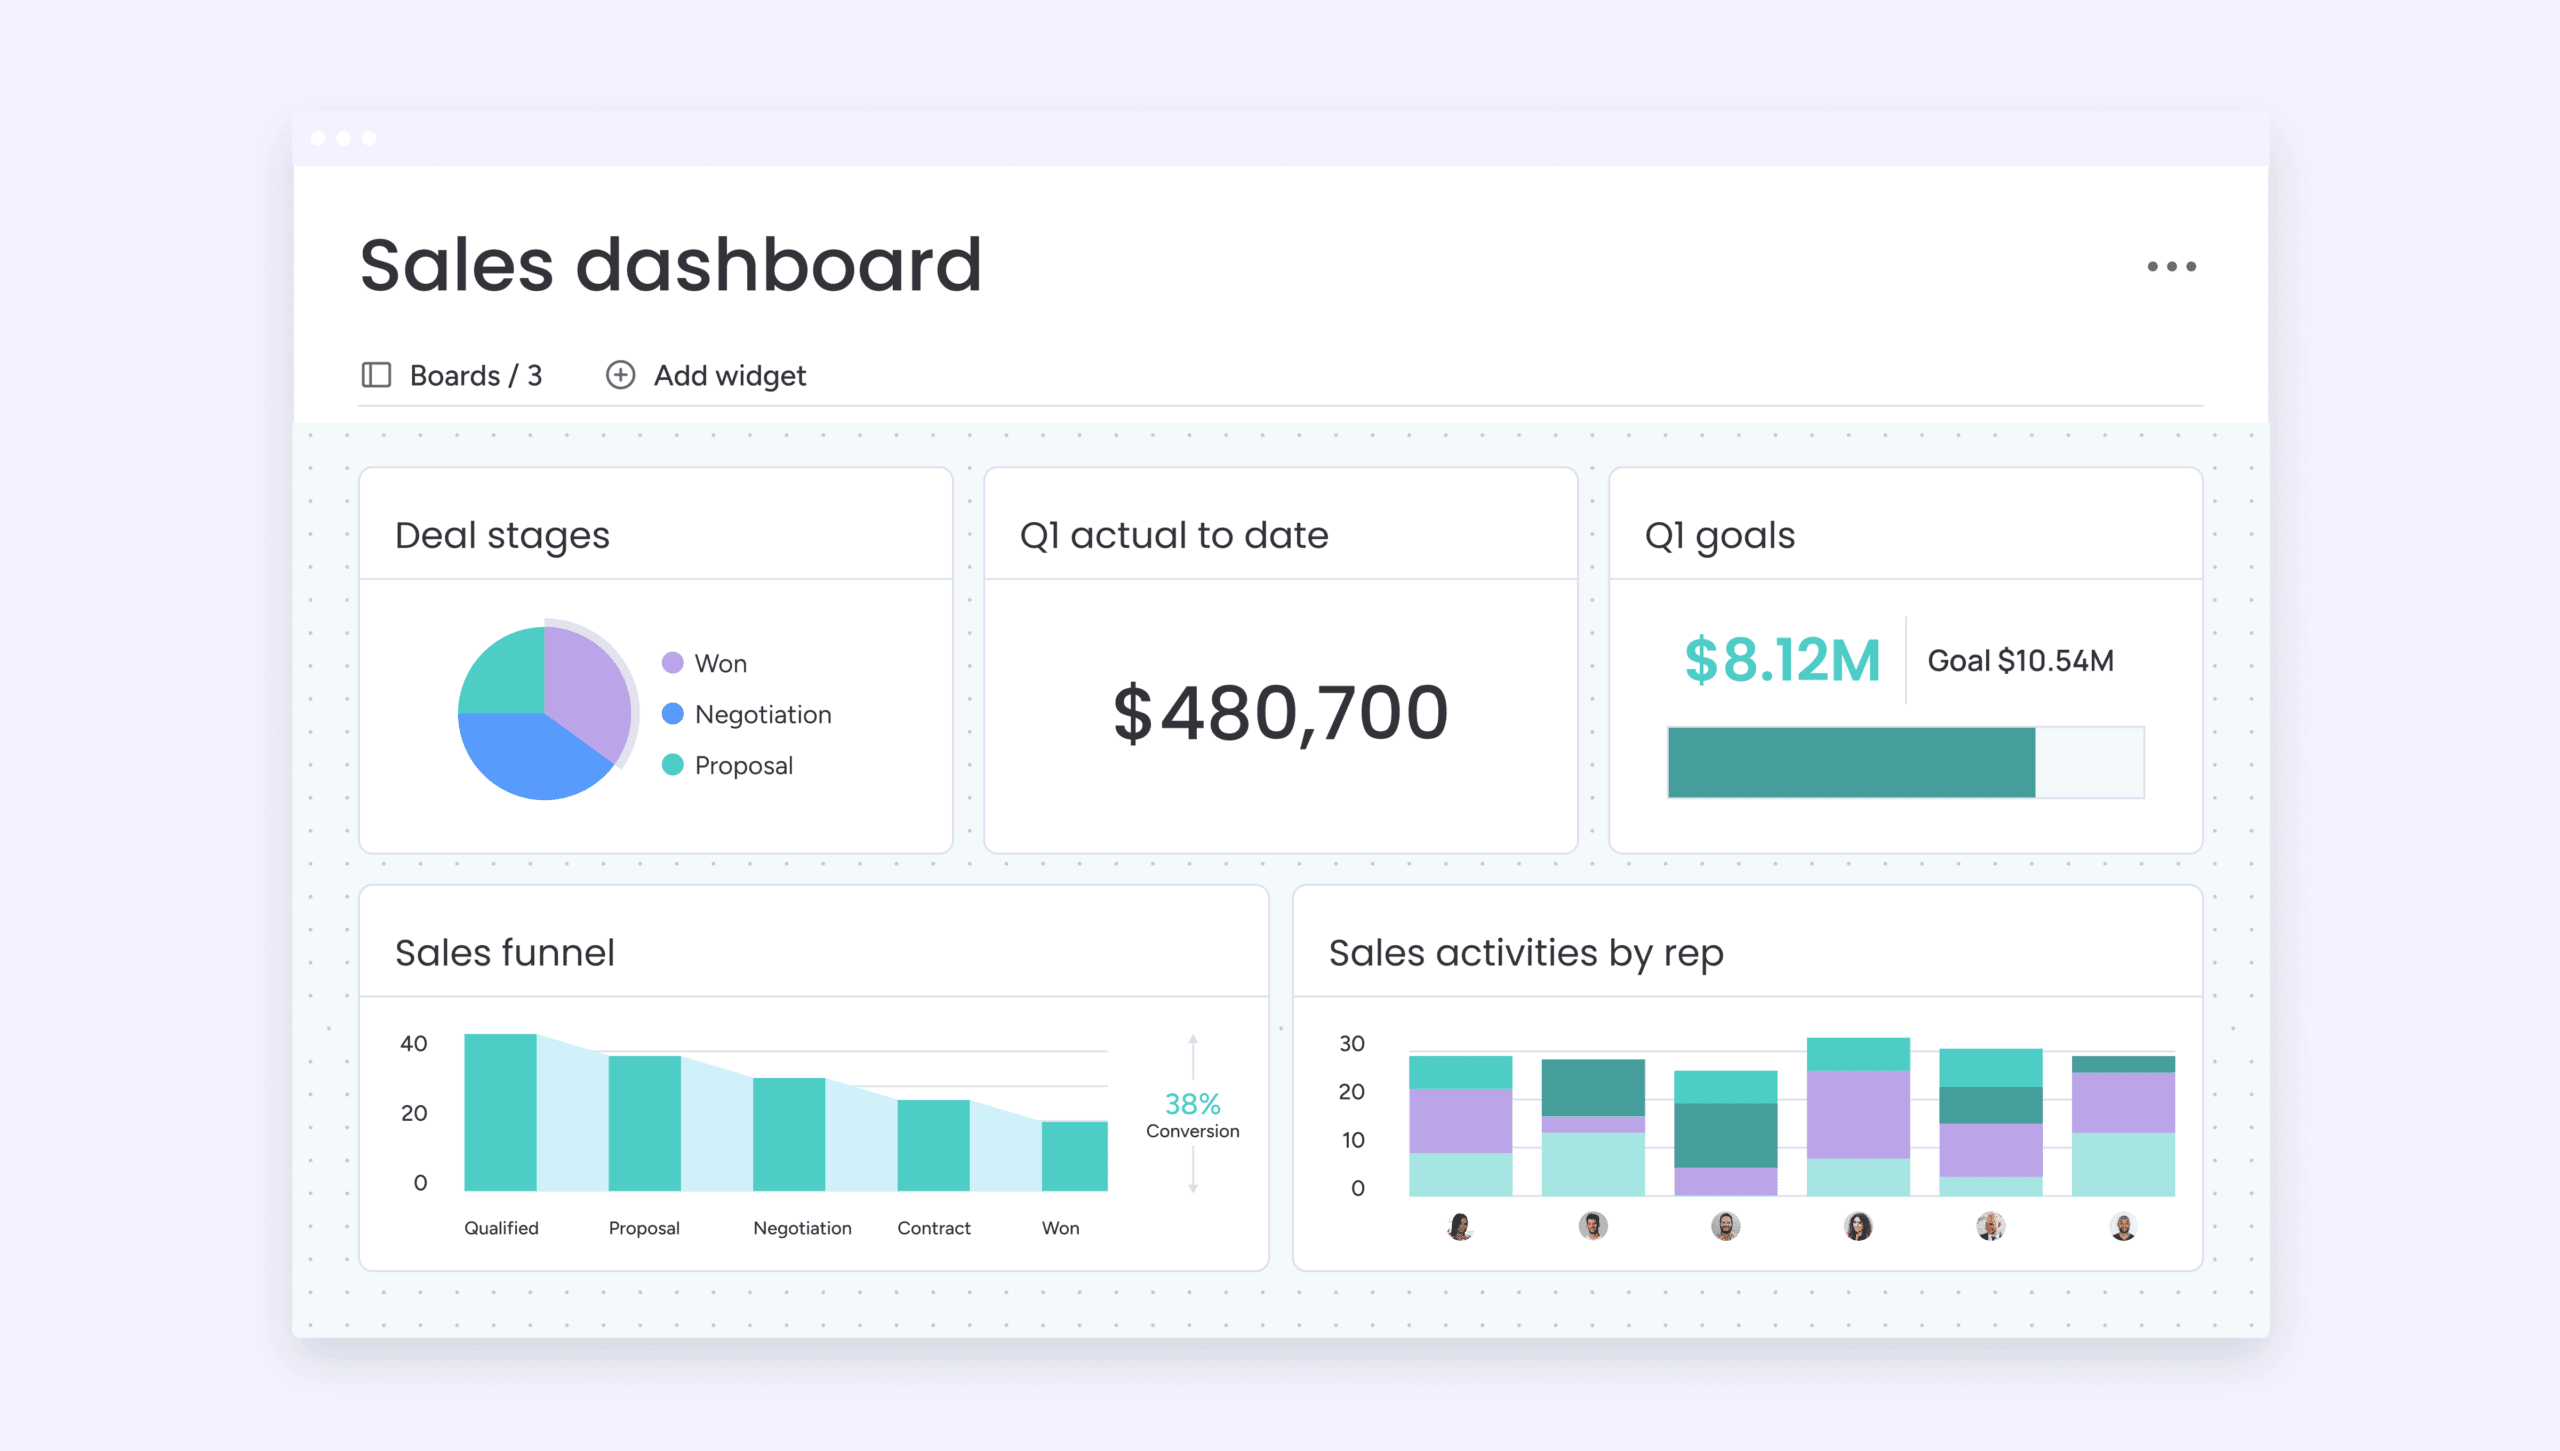
There are endless configurations for sales dashboards that will help you visually track metrics. However, before you even think about what you want included on a dashboard or in sales metrics reports, you first need to decide on the software you want to use to track it all. A visual solution like monday CRM can help teams track and visualize metrics in real time and even apply AI insights for deeper analytics.
Sales teams can also have different dashboards and reports to serve different purposes. For example, some of the dashboard configurations you might consider implementing include:
- Sales leaderboards with real-time deal closure metrics such as win rate, meetings booked, and MRR
- Sales activities dashboard that shows emails sent, number of calls made, and follow-ups sent
- Performance overview dashboards that include a mix of different metrics, like revenue, deals in a pipeline, conversion rate, and forecasted deals
- Sales manager dashboard that shows daily, monthly, or quarterly sales performance, MRR, sales target progress, new accounts, and more
SaaS and B2B sales metrics that matter most
We’ve already touched on metrics like MRR, CAC, CLV, churn, and renewal rate — but they deserve a closer look. For SaaS and B2B teams, these numbers aren’t just part of the big picture; they define the business model itself.
- MRR (monthly recurring revenue): In subscription-driven businesses, MRR is your heartbeat. Without a stable base of recurring revenue, forecasting becomes guesswork.
- CAC (customer acquisition cost): In B2B, where deal cycles are long and complex, CAC shows whether your go-to-market strategy is financially sustainable.
- CLV (customer lifetime value): Balancing CLV against CAC reveals whether your customer relationships are profitable long-term — crucial when renewals and upsells drive most of your growth.
- Churn and renewal rates: For SaaS companies, even a small uptick in churn can wipe out growth gains. Renewal rates, on the other hand, validate product value and customer satisfaction.
Together, these B2B sales metrics paint the picture of whether your growth is profitable, predictable, and sustainable. And with monday CRM, SaaS and B2B teams can bring all these recurring-revenue metrics into one place, apply AI-driven churn predictions, and build more accurate growth forecasts. Let’s dive into what monday CRM brings to the table.
Leveraging monday CRM for sales metrics that drive growth
While there are standalone analytics platforms teams can use to track sales metrics, opting for an all-encompassing solution like an AI CRM can turn simple metrics into actionable strategies. With a platform like monday CRM, teams can not only track and visualize key metrics in real-time, but also use the information to instantly improve pipeline management, team performance, and sales rep productivity.
Packed with advanced CRM automation and AI features, monday CRM can help teams update deal stages, assign tasks, and send automated notifications based on data. The platform’s AI capabilities can help teams analyze sales data and predict future performance to identify opportunities for improvement.
Let’s take a closer look at some of monday CRM’s key features for using sales metrics to improve efficiency.
Customizable AI-driven dashboards
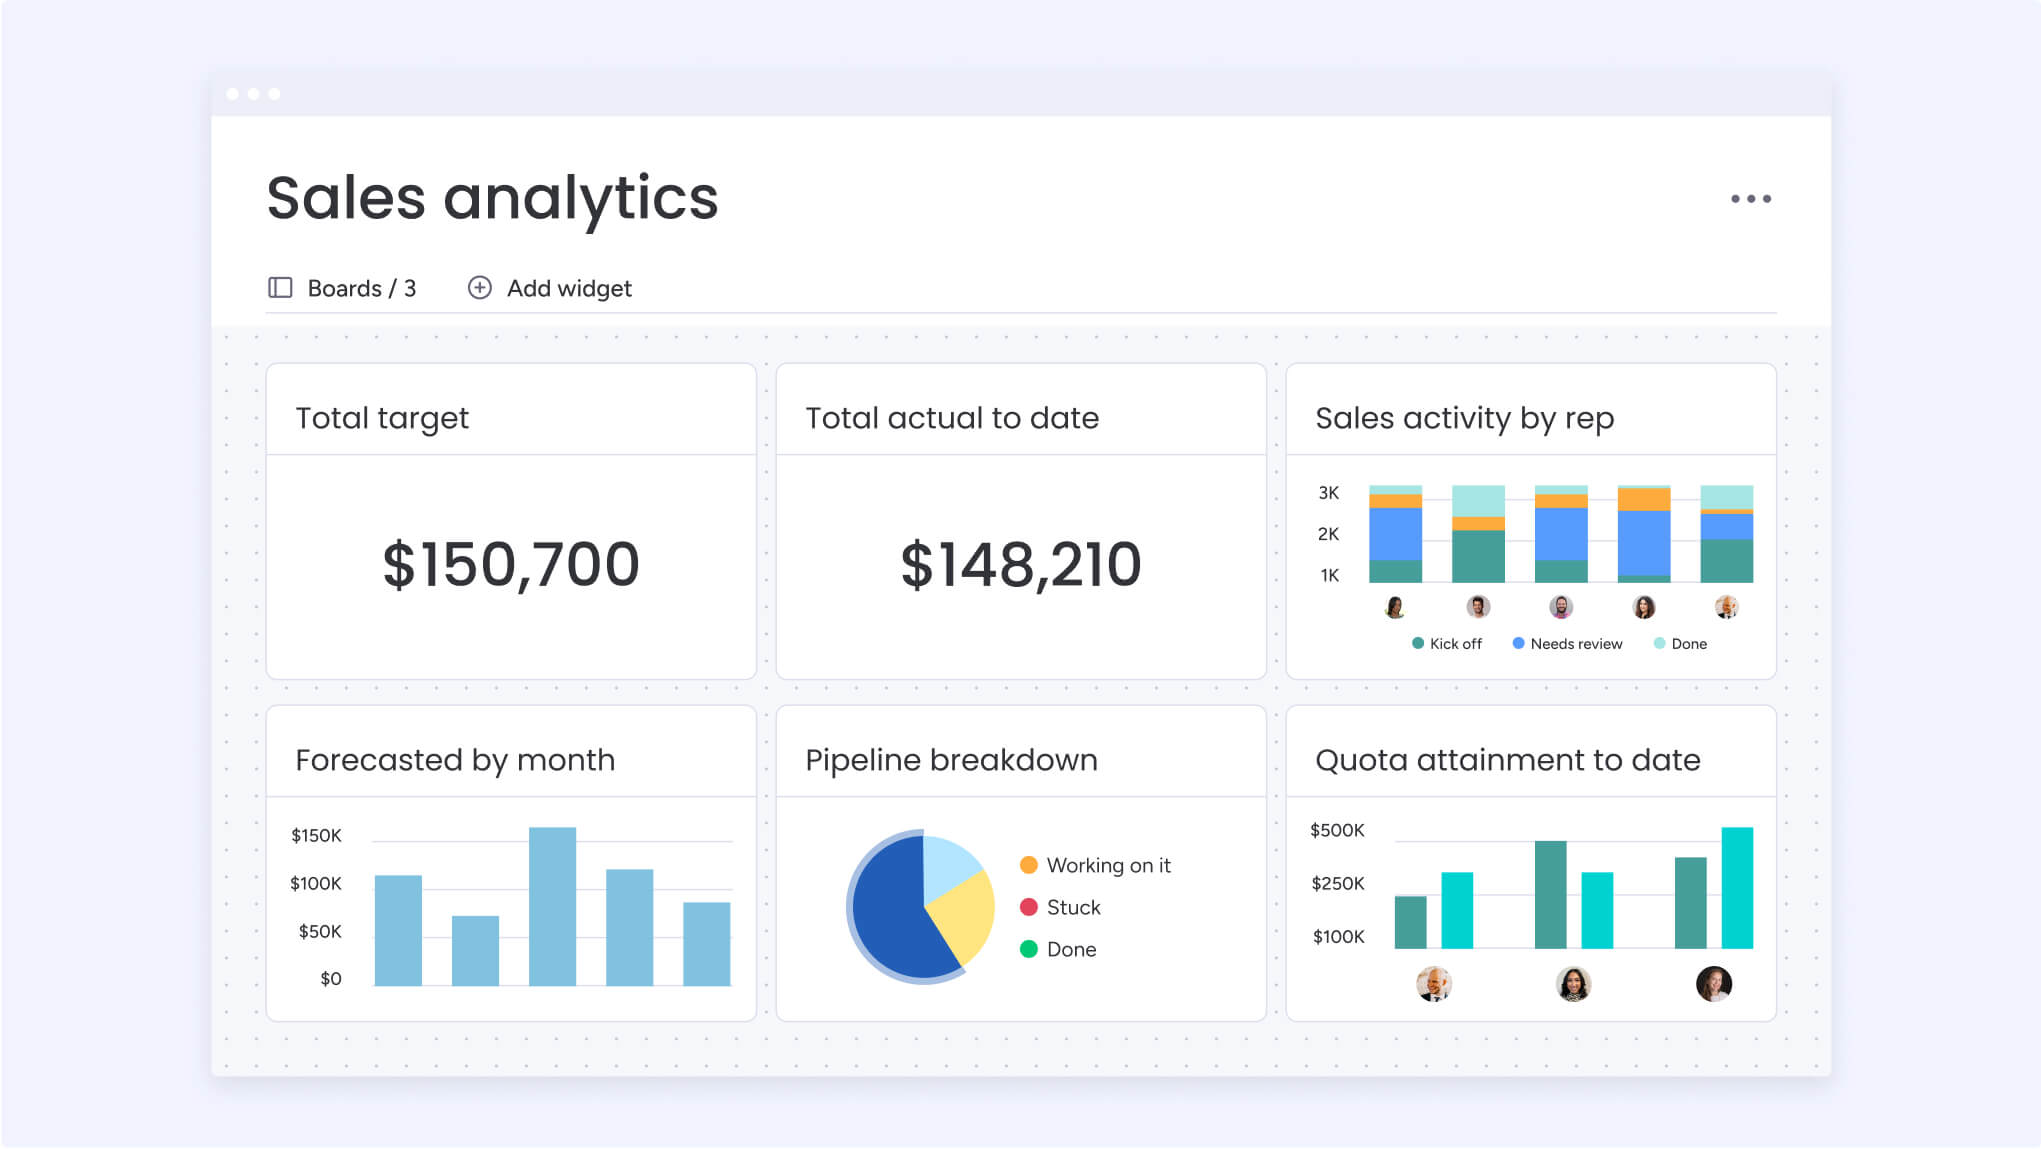
With monday CRM, sales teams can build and customize their own sales dashboards that display essential data in real-time. To give them even more of a boost, dashboards can pull AI data such as sales forecasts and predicted sales to give teams more insights into goal attainment and deals in the pipeline.
Predictive analytics and sales forecasting
Sales teams can make the most of predictive analytics and sales forecasting tools in monday CRM. These metrics help teams understand where to focus both their efforts and resources, whether it’s a deal that’s at risk of falling through or incoming prospects that have a high likelihood to convert based on historical trends.
AI-powered pipeline management
The metrics you track in monday CRM can be used to create AI-led automations in your sales pipeline. For example, if your sales cycle length metric shows a deal has been stuck in the same stage for longer than your average cycle time, the system can automatically assign a follow-up task to the right sales rep and notify the sales manager to intervene.
AI customer sentiment analysis
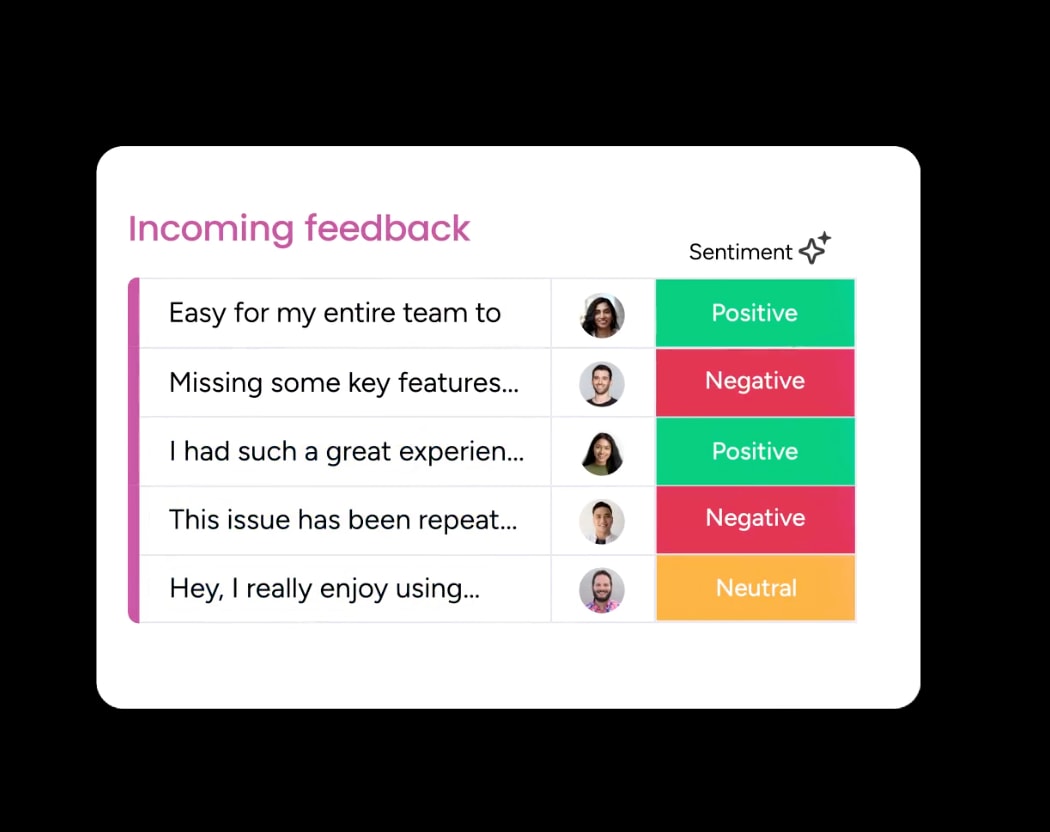
When it comes to customer satisfaction metrics, sometimes numbers alone aren’t enough. With monday CRM, teams can track sentiment from email chains, meeting notes, and call logs to uncover further insights about how a customer really feels. For example, if sentiment analysis detects negative language patterns in recent customer communications while their CSAT scores remain average, the system can automatically create a task for the sales rep to schedule a check-in call before potential issues escalate.
Turning metrics into results
Tracking the right sales metrics is essential for driving growth, but the real power comes from turning that data into action. By focusing on a balanced mix of activity, performance, and customer-focused metrics, teams can optimize processes for a smoother path to success. With monday CRM’s AI-powered analytics, predictive forecasting, and automated workflows, sales teams don’t just track metrics, they transform them into competitive advantages that lead to sustainable revenue growth.
Try monday CRMFAQs
What metrics help evaluate AI performance in sales?
To evaluate AI performance in sales, track AI-specific metrics like prediction accuracy rates, lead scoring precision, automated email response rates, and time saved through automation. Also, monitor how AI recommendations affect metrics like conversion rates, sales cycle length, and deal closure rates to measure the overall impact on sales performance.
What are the most important sales metrics to track for a small business?
Small businesses should focus on metrics that directly impact cash flow, such as monthly recurring revenue, customer acquisition cost, win rate, average deal size, and sales cycle length. It’s also a good idea for small businesses to track pipeline velocity and customer lifetime value to ensure sustainable growth without overcomplicating reporting.
How do sales metrics differ from marketing metrics?
Sales metrics focus on converting qualified leads into customers and generating revenue, while marketing metrics track lead generation, brand awareness, and top-of-funnel activities. Sales metrics are also meant to measure deal closure and customer relationships, and marketing metrics measure lead quality, campaign performance, and audience engagement.
What metrics can help a sales manager improve team performance?
Sales managers can improve overall team performance by monitoring individual reps through activity metrics like calls made and meetings booked, alongside conversion metrics like win rates and average deal sizes. It’s also important to track coaching indicators such as sales cycle length by rep, follow-up consistency, and quota attainment to identify skill gaps and opportunities for growth.
How do you use sales metrics to forecast revenue?
To forecast revenue using sales metrics, sales teams should combine pipeline value with historical win rates and average sales cycle length. Use weighted pipeline values based on deal stage probabilities, analyze seasonal trends from past performance, and factor in team capacity to create accurate forecasts. AI is also very helpful here in analyzing historical sales data to deliver instant predictions that are reliable and accurate.
What are the typical sales pipeline metrics, such as first meetings, monthly quota, and conversion rates?
In monday CRM, these metrics serve as the primary indicators of your team's health. First meetings measure the top-of-funnel activity and lead generation efforts, while your monthly quota tracks the percentage of revenue targets achieved by each rep. Conversion rates pinpoint the efficiency of your process by showing the ratio of leads that successfully transition between stages (e.g., from meeting to closed-won). Monitoring these together allows you to identify exactly where deals are stalling and how to optimize your workflow for better results.