HomeUse Cases

AI Gantt Charts

Create Gantt charts with AI

Describe your project and AI builds a full Gantt timeline - with tasks, dependencies, milestones, and owner assignments. Then AI risk analysis monitors it continuously so delays don't become surprises.

Get Started
No credit card needed ✦ Unlimited time on Free plan
ai gantt chart software

Trusted by over 60% of the Fortune 500

A Gantt chart that lives where your project data does

monday.com's Gantt View is part of your project board — not a separate export. Task updates, dependency changes, and milestone completions reflect on the timeline in real time, automatically.

AI that monitors your timeline, not just displays it

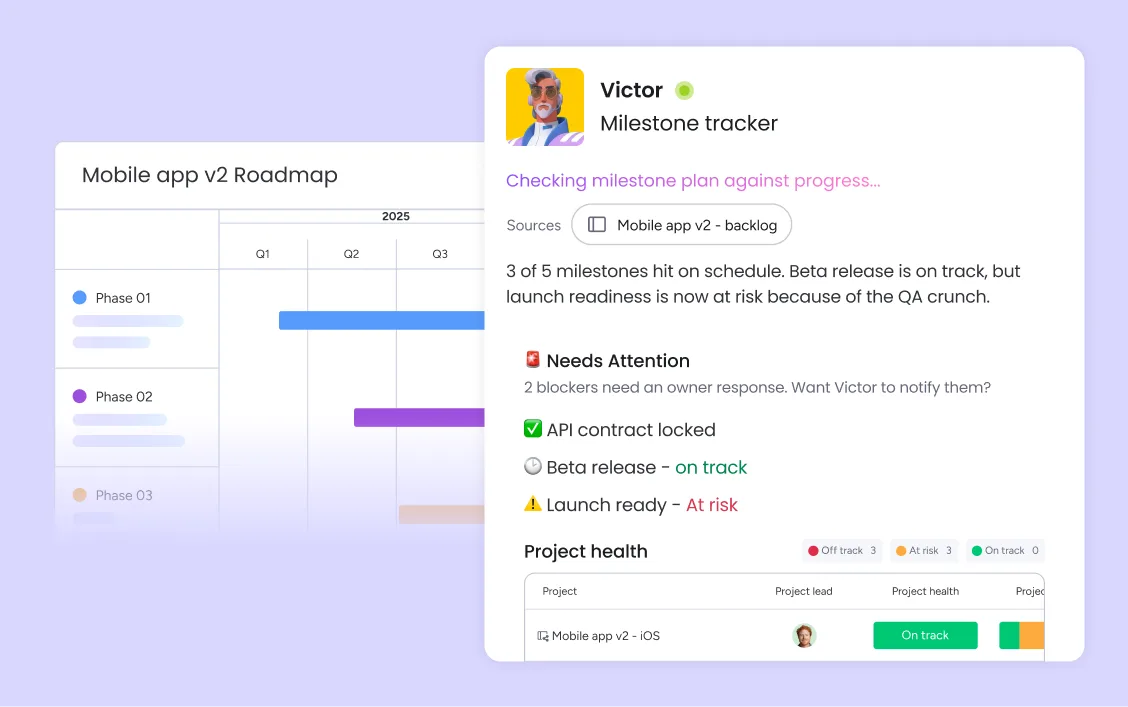
The AI Risk Analyzer continuously scans your Gantt for at-risk tasks, dependency conflicts, and overdue milestones — surfacing delays before they cascade across the critical path.

Drag-and-drop simplicity, enterprise-grade depth

Adjust timelines, reassign owners, and shift dependencies with a single drag. Gantt templates get any project type running in minutes, and the Gantt view scales from a single project to a full multi-project portfolio.

Create Gantt charts with AI in minutes

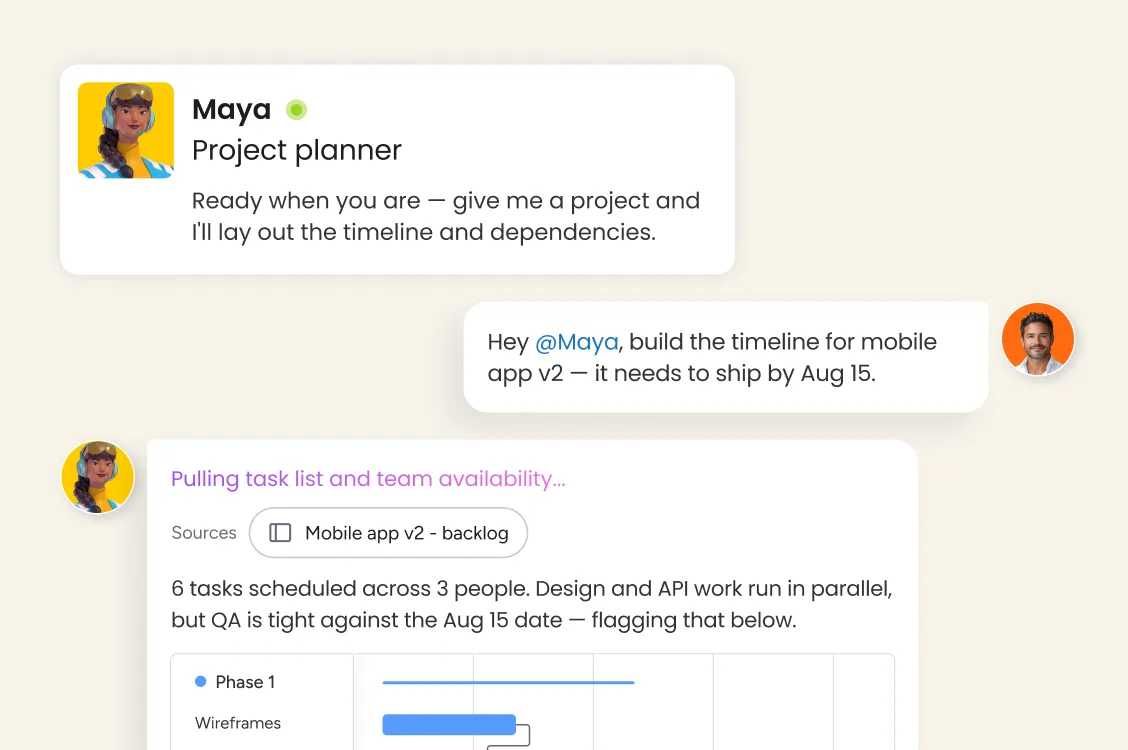
Describe your project in plain language and monday sidekick, our pre-built ai assistant, generates a full Gantt timeline - tasks, durations, dependencies, milestones, and owner assignments structured and ready to share. Give stakeholders a clear view with AI-generated project timeline summaries.

Get Started
ai gantt chart generator monday.com
gantt chart milestone tracking monday.com

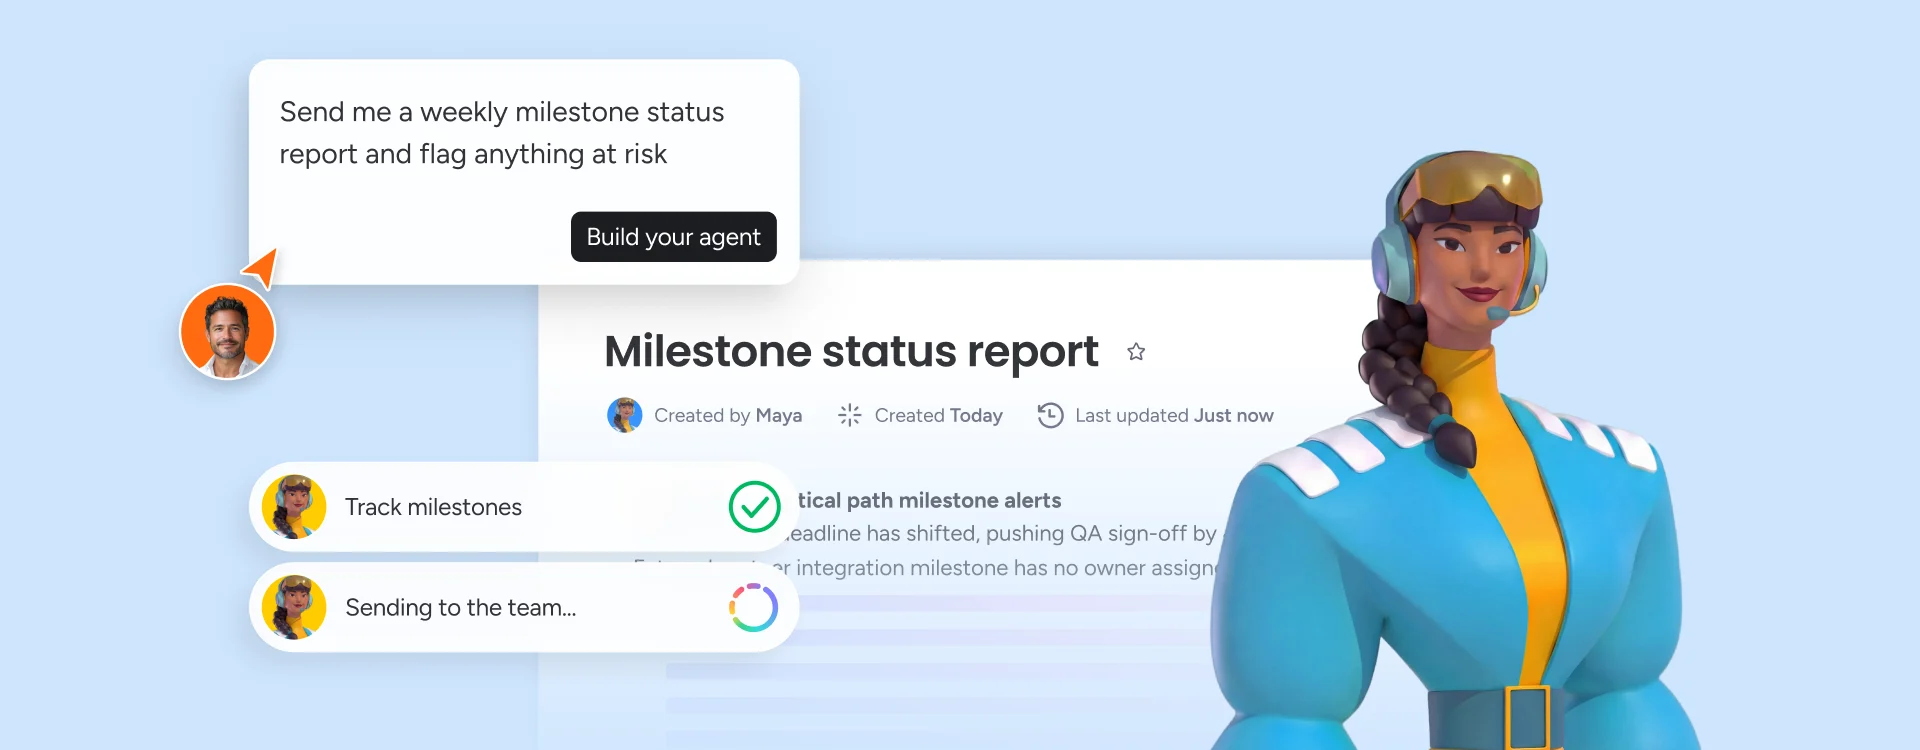
Track project milestones and deadlines across the full timeline

The AI Risk Analyzer continuously scans your Gantt for at-risk tasks, dependency conflicts, and overdue milestones — surfacing delays before they cascade across the critical path.

Get Started

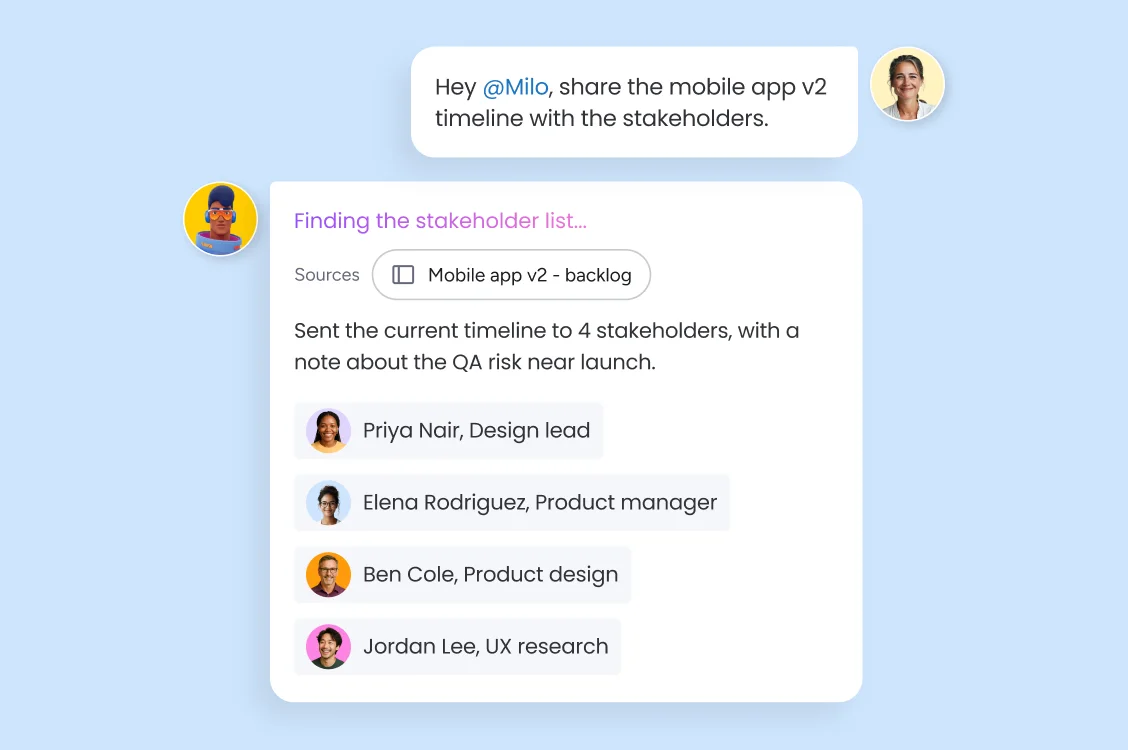
Share your Gantt chart in one click

Calendar sync with Google Calendar and Outlook keeps your Gantt aligned with your team's schedule automatically. Multi-project Gantt view gives portfolio managers a single timeline across every active project, so resource conflicts and cross-project dependencies are visible before they become blockers.

Get Started
gantt chart sharing with stakeholders monday.com

Works with the tools your project teams already use

monday.com connects your AI workflow automation software to the tools every team runs on. With 850+ integrations — including Slack, Jira, Microsoft Teams, Google Calendar, GitHub, and Salesforce — and MCP support for Claude, ChatGPT, and Copilot, your portfolio data stays connected wherever your teams work.

Gmail
Slack
Claude
Drive
Salesforce
Hubspot
Jira
Calendar
Zoom
GitHub
Teams
ChatGPT
Cursor

850+

more via API, MCP & native connectors

Solutions for every team, powered by AI

Your descriptive text here

Legal

Track timelines and deadlines for every case

Map matter workflows, regulatory deadlines, and review dependencies on a Gantt timeline — so your legal team has full visibility into what's due, what's blocking what, and when escalation is needed.

Get Started
Your descriptive text here

HR

Plan hiring cycles and onboarding timelines

Gantt view maps the full hiring and onboarding workflow — from job posting to new-hire day one — with milestone tracking and automated deadline reminders so no step gets missed.

Get Started
Your descriptive text here

PMO & Ops

Get a single Gantt view across your entire portfolio

Multi-project Gantt view gives your PMO a live timeline across every active initiative — milestones, resource conflicts, and critical path risks visible in one place, without opening each project separately.

Get Started
Your descriptive text here

Product

Track sprints, releases, and milestones on one timeline

Gantt view maps sprint dependencies, release milestones, and cross-team handoffs in one timeline - with AI risk analysis flagging blockers before they slip sprint commitments.

Get Started
Your descriptive text here

Marketing

Plan and track campaigns on a live Gantt timeline

Map every campaign phase - brief, creative, approvals, launch, reporting - on a Gantt chart with dependencies, so your team sees exactly when each workstream needs to deliver and what's blocking what.

Get Started

How to create Gantt charts with AI.

Get Started
01

Step 1 - Build your project plan in minutes with AI

Describe your project in plain language and monday sidekick generates a full structured Gantt chart — tasks, durations, milestones, dependencies, and owner assignments. Or choose from Gantt templates for your project type and customize from there. Either way, your timeline is ready to share within minutes, not hours.

02

Step 2 - Set up task dependencies in your Gantt chart

Link tasks with dependency arrows directly on the Gantt View - finish-to-start, start-to-start, or finish-to-finish - so the critical path is always visible. When a dependency shifts, monday automatically cascades the change across every connected task, keeping your timeline accurate without manual recalculation.

03

Step 3 - Build an agent to track project milestones and share with stakeholders

Build a monday agent that adds milestone markers to your Gantt timeline and shares a live view with stakeholders - clients, executives, or external partners - in one click. Share it with the rest of the team for full visibility across the project and have it automatically alert the right team member when a deadline is missed.

Features

Gantt templates for project planning

Start any project type from a pre-built Gantt template — product launches, marketing campaigns, construction projects, event planning, software releases, and more. Templates include task structures, dependency logic, and milestone frameworks ready to customize.

Automatic calendar sync

Sync your Gantt chart milestones and task deadlines with our Google Calendar and Outlook integrations - so your project schedule and personal calendar stay aligned without manual updates.

Multi-project Gantt view

View all active projects on a single Gantt timeline to identify resource conflicts, cross-project dependencies, and portfolio-level delivery risks at a glance — without switching between individual project boards.

Critical path visualization

See the critical path highlighted directly on your Gantt chart — the longest chain of dependent tasks that determines your project's minimum delivery date. Any delay on the critical path is immediately visible, so project managers can prioritize the right work.

AI Risk Analyzer for project delays

The AI Risk Analyzer continuously scans your Gantt charts for at-risk tasks, missed dependencies, and deadline conflicts — surfacing issues before they cascade. Proactive alerts route to the right team member with full context, so problems get addressed before they affect delivery.

AI milestone tracking

Add milestone markers to any Gantt timeline to track critical project checkpoints — phase completions, delivery dates, stakeholder reviews, and go-live targets. Milestones are visible across both the Gantt view and portfolio dashboards.

AI-generated Gantt timelines

Describe your project in plain language and monday sidekick builds a complete Gantt chart — tasks, durations, dependencies, milestones, and owner assignments structured automatically.

Gantt chart view with dependencies

A live, interactive Gantt view built into your project board. Link tasks with dependency arrows, visualize the critical path, and see how shifts in one task ripple across the entire timeline — all without leaving your workspace.

One AI Work Platform for every project team

Get Started

monday agents

Ready-made or custom agents that generate project status reports, escalate at-risk milestones, and route alerts to the right stakeholders automatically.

monday workflows

Build automated project workflows that trigger based on Gantt events - milestone completions, overdue tasks, or dependency changes - without writing code.

monday sidekick

Your AI assistant that generates Gantt timelines from project descriptions, summarizes project status, and recommends next steps - inside your workspace.

monday vibe

Create custom project dashboards and timeline apps for your team in minutes, without engineering support.

Real customers. Unreal outcomes.

Frequently
Asked Questions

Does monday.com have an app for creating gantt charts?

Yes, the monday.com app is available for download on iOS and Android app stores.

How much does monday.com Gantt chart software cost?

Gantt chart software ranges from free plans to enterprise pricing. monday.com offers a free plan for up to 2 seats with no credit card required, including the Gantt view. Paid plans start at $9/seat/month (Basic), $12/seat/month (Standard), and $19/seat/month (Pro), billed annually. AI capabilities including the AI risk analyzer, AI-generated timelines, and monday agents are available on Standard and above. Contact sales for Enterprise pricing.

What is the difference between a Gantt chart and a Kanban board?

A Gantt chart visualizes project work as a timeline — showing task durations, dependencies, and the critical path. A Kanban board visualizes work as a flow — showing tasks moving through stages from to-do to done. monday.com supports both views on the same board, so teams can switch between timeline planning and workflow execution without duplicating data.

Why is monday.com the best free Gantt chart software?

monday.com's free plan includes access to the Gantt View, drag-and-drop scheduling, and dependency tracking — no credit card required. Paid plans add AI risk analysis, AI-generated timelines, multi-project Gantt view, calendar sync, automated deadline reminders, and monday agents for autonomous project monitoring. monday.com is rated #1 on G2 and recognized as a Gartner Leader in 4 quadrants.

How do you track project milestones in a Gantt chart?

In monday.com, milestones appear as diamond-shaped markers on the Gantt timeline, representing critical checkpoints like phase completions, delivery dates, or stakeholder approvals. Automated deadline reminders notify owners before milestones approach, and the AI risk analyzer flags any milestone at risk of slipping based on the current state of upstream tasks.

What are task dependencies in a Gantt chart?

Task dependencies define the relationships between tasks — which tasks must finish before others can start, and which can run in parallel. Common types include finish-to-start (the most common), start-to-start, and finish-to-finish. On monday.com, dependencies are set with a single link on the Gantt View, and changes cascade automatically across every connected task when dates shift.

What is the difference between a Gantt chart and a project timeline?

A project timeline is a simple chronological view of key dates and milestones. A Gantt chart is more detailed — it shows every task, its duration, its owner, and the dependency relationships between tasks. Gantt charts reveal the critical path and show how a delay in one task affects downstream work. monday.com offers both views within the same board, so teams can choose the right level of detail for their audience.

What is Gantt chart software used for?

Gantt chart software is used to plan project schedules, visualize task timelines, manage dependencies, track milestones, and communicate project status to stakeholders. monday.com's Gantt chart software goes further — the AI risk analyzer continuously monitors your timeline for at-risk tasks and the critical path, so project managers can see and address delays before they impact delivery.

How do you create Gantt charts with AI?

With monday.com, describe your project in plain language and monday sidekick generates a full Gantt chart — tasks, durations, dependencies, milestones, and owner assignments — in minutes, ready to share with stakeholders from day one. You can also start from a Gantt template for your project type and customize from there, or build from scratch using the drag-and-drop Gantt view inside your project board. Once the timeline is live, you can create a monday agent that monitors it continuously and scans it for at-risk tasks, dependency conflicts, and overdue milestones.